Someone smart please help
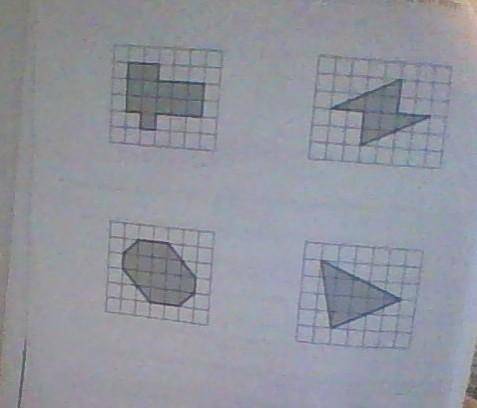
Find the area that is shaded in each figure in at least two di...

Mathematics, 05.05.2020 04:00 KelseyCope1184
Someone smart please help
Find the area that is shaded in each figure in at least two different ways.

Answers: 1


Another question on Mathematics
Mathematics, 21.06.2019 15:30
What is the domain and range of each function 1. x (3, 5, 7, 8, 11) y ( 6, 7, 7, 9, 14) 2. x (-3, -1, 2, 5, 7) y (9, 5, 4, -5, -7)
Answers: 2
Mathematics, 21.06.2019 21:00
Ireally need subtract and simplify.(-y^2 – 4y - 8) – (-4y^2 – 6y + 3)show your work, ! i will mark you brainliest but you have to show your work.
Answers: 1
Mathematics, 21.06.2019 22:30
Need same math paper but the back now i hope your able to read it cleary i need with hw
Answers: 1
Mathematics, 22.06.2019 01:00
The weight of 46 new patients of a clinic from the year 2018 are recorded and listed below. construct a frequency distribution, using 7 classes. then, draw a histogram, a frequency polygon, and an ogive for the data, using the relative information from the frequency table for each of the graphs. describe the shape of the histogram. data set: 130 192 145 97 100 122 210 132 107 95 210 128 193 208 118 196 130 178 187 240 90 126 98 194 115 212 110 225 187 133 220 218 110 104 201 120 183 124 261 270 108 160 203 210 191 180 1) complete the frequency distribution table below (add as many rows as needed): - class limits - class boundaries - midpoint - frequency - cumulative frequency 2) histogram 3) frequency polygon 4) ogive
Answers: 1
You know the right answer?
Questions

English, 13.11.2021 06:50


Computers and Technology, 13.11.2021 06:50
Mathematics, 13.11.2021 06:50
Mathematics, 13.11.2021 06:50


English, 13.11.2021 06:50


Social Studies, 13.11.2021 06:50
Mathematics, 13.11.2021 06:50

Business, 13.11.2021 06:50
Mathematics, 13.11.2021 06:50


