
Mathematics, 05.05.2020 03:29 bbyjoker
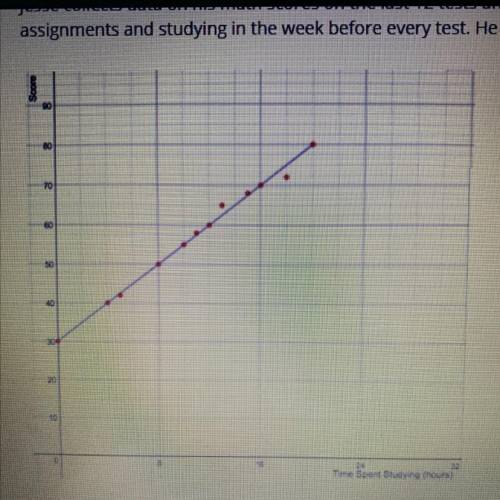
Jesse collects data on his math scores on the last 12 tests and the number of hours he spent completing his math homework
assignments and studying in the week before every test. He creates a scatter plot to show the data.
Assa
Sect
Time Serrano
Sect
The regression line shown on the graph best models the data on the scatter plot.
Based on the given model, how many hours in the week before the test does Jesse need to study to get a score of 90 on the test? Round
your answer to the nearest hour

Answers: 2


Another question on Mathematics
Mathematics, 21.06.2019 20:40
Formulate the indicated conclusion in nontechnical terms. be sure to address the original claim. the foundation chair for a hospital claims that the mean number of filled overnight beds is over 523, and she is therefore justified starting a funding campaign to add a wing to the hospital. assuming that a hypothesis test has been conducted and that the conclusion is failure to reject the null hypothesis, state the conclusion in nontechnical terms.
Answers: 3
Mathematics, 21.06.2019 23:20
Predict which statements are true about the intervals of the continuous function. check all that apply
Answers: 3
Mathematics, 22.06.2019 00:00
If (x + 8) is a factor of f(x), which of the following must be true? both x = –8 and x = 8 are roots of f(x). neither x = –8 nor x = 8 is a root of f(x). f(–8) = 0 f(8) = 0
Answers: 3
You know the right answer?
Jesse collects data on his math scores on the last 12 tests and the number of hours he spent complet...
Questions
Mathematics, 19.10.2020 19:01


Computers and Technology, 19.10.2020 19:01
Computers and Technology, 19.10.2020 19:01

Computers and Technology, 19.10.2020 19:01


