
Mathematics, 05.05.2020 03:29 calindaperez
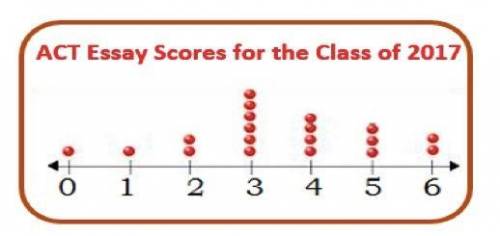
The dot plot shows the ACT Essay Scores for the Class of 2017. Write True or False based on the below statements and the provided data.
a)
The values range from 1-6.
b)
There is a peak at 3.
c)
The mean is 3.
d)
The median is 3.

Answers: 3


Another question on Mathematics
Mathematics, 21.06.2019 13:00
Use this data in the problem below. follow the steps carefully. round to the nearest tenth. lot 3: week 1: 345 week 2: 340 week 3: 400 week 4: 325 step 1. jim enters the data and calculates the average or mean. step 2. jim calculates the deviation from the mean by subtracting the mean from each value. step 3. jim squares each deviation to remove negative signs. step 4. jim sums the squares of each deviation and divides by the count for the variance. step 5. jim takes the square root of the variance to find the standard deviation.
Answers: 2
Mathematics, 21.06.2019 23:30
Find measure angle 1 and measure angle 3 in the kite the diagram is not drawn on the scale
Answers: 1
You know the right answer?
The dot plot shows the ACT Essay Scores for the Class of 2017. Write True or False based on the belo...
Questions

English, 13.12.2019 21:31

Chemistry, 13.12.2019 21:31


Geography, 13.12.2019 21:31
Biology, 13.12.2019 21:31
English, 13.12.2019 21:31
Geography, 13.12.2019 21:31
Chemistry, 13.12.2019 21:31


