The histogram below is the data from the 2017 FSA Readiness Assessment taken by sixth graders.
...

Mathematics, 05.05.2020 03:31 victoria6929
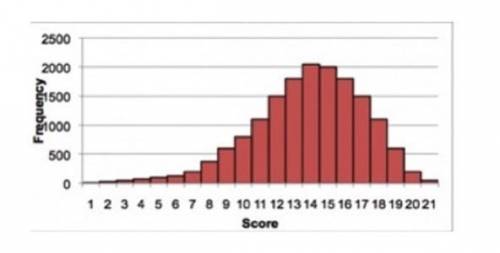
The histogram below is the data from the 2017 FSA Readiness Assessment taken by sixth graders.
Use the distribution to determine which answer choices are true or false. SELECT ALL THAT APPLY.
A) The distrubition ranges between scores of 1 and 21.
B) The distribution has a peak at a score of 14.
C) The distribution shows teh data is skewed to the right.
D) The distribution does not have a cluster between 1 and 2.
E) The distribution shows a total of 4000sixth graders scored either a 12 or 14.

Answers: 3


Another question on Mathematics
Mathematics, 21.06.2019 18:20
Me solve this problem, and someone clearly explain to me how to solve it.1.) use the value of the discriminant to determine if the given trinomials has 2 real solutions, 1 real solution, or no real solutions.a. x2 − 4x − 7 = 0b. 4r2 + 11r − 3 = 0c. 3m2 + 7 = 0d. t2 + 2t + 1 = 0
Answers: 1
Mathematics, 21.06.2019 19:00
If olu is twice as old as funmi if the sum of their ages is 60 how old is olu
Answers: 1
Mathematics, 21.06.2019 20:00
Ahiker stands at an unknown elevation before he ascends 2 miles up a mountain to an elevation of 9 miles. find the elevation of the hiker before his ascent.
Answers: 1
Mathematics, 21.06.2019 20:30
Find the solution(s) to the system of equations. select all that apply y=x^2-1 y=2x-2
Answers: 2
You know the right answer?
Questions

Mathematics, 24.02.2020 18:49


History, 24.02.2020 18:49

Chemistry, 24.02.2020 18:49

History, 24.02.2020 18:49
Social Studies, 24.02.2020 18:50
Mathematics, 24.02.2020 18:50


