
Mathematics, 05.05.2020 00:47 krab38
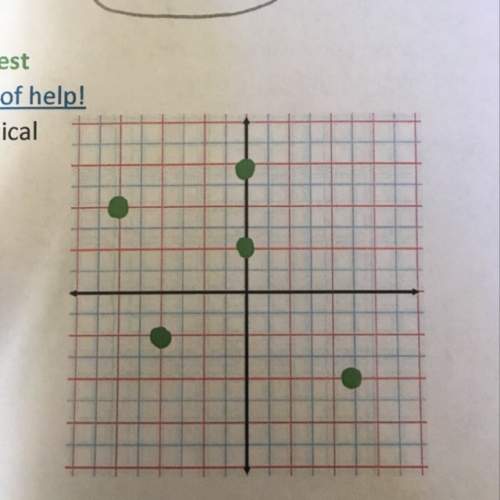
The graph shows the decrease in the percentage of Canadians below the poverty level from 1992 to 1997. If the rate of decrease continues, the percentage of Canadians below the poverty level in 2011 will be
A) 23.24%.
B) 26.04%.
C) 28.24%.
D) 43.12%.

Answers: 2


Another question on Mathematics
Mathematics, 21.06.2019 15:00
Given the choice between receiving $1.000.000 in one month or a single penny-doubled everyday for the period of one month; which option would you choice? show your work to support your answer. (assume that 1 month=30 days)
Answers: 1
Mathematics, 21.06.2019 15:30
Acircular city park has a sidewalk directly through the middle that is 111 - feet long. if each bag of fertilizer covers 50 square feet, then determine how many bags of fertilizers the parks and recreation department needs to use to cover the circular park. ignore all the sidewalks around and through the park.
Answers: 1
Mathematics, 21.06.2019 16:00
What value of x will make the triangles similar by the sss similarity theorem?
Answers: 3
Mathematics, 21.06.2019 23:30
What are the measures of angles a, b, and c? show your work and explain your answers. 25 points
Answers: 1
You know the right answer?
The graph shows the decrease in the percentage of Canadians below the poverty level from 1992 to 199...
Questions


Social Studies, 04.05.2020 22:35

English, 04.05.2020 22:35


History, 04.05.2020 22:35
Mathematics, 04.05.2020 22:35
Mathematics, 04.05.2020 22:35
Mathematics, 04.05.2020 22:35
Mathematics, 04.05.2020 22:35
Biology, 04.05.2020 22:35
Mathematics, 04.05.2020 22:35

Chemistry, 04.05.2020 22:35


