Which of the following could represent the function shown in the graph?
f(x) = (x + 4)(x...

Mathematics, 05.05.2020 03:47 blake12345v
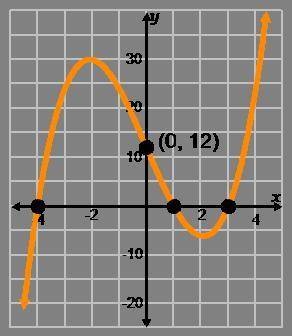
Which of the following could represent the function shown in the graph?
f(x) = (x + 4)(x – 1)(x – 3)
f(x) = x(x + 4)(x – 1)(x – 3)
f(x) = (x – 12)(x + 4)(x – 1)(x – 3)

Answers: 1


Another question on Mathematics
Mathematics, 20.06.2019 18:04
Horace's speedometer reads 60 miles per hour, but during a road test he finds that he was actually driving 58 mph. what is the percent error in horaces speedometer?
Answers: 1
Mathematics, 21.06.2019 20:00
The scatterplot below shows the number of hours that students read weekly and the number of hours that they spend on chores weekly. which statement about the scatterplot is true?
Answers: 2
Mathematics, 21.06.2019 22:00
Find two numbers if their sum is 91 and the ratio is 6: 7?
Answers: 1
Mathematics, 21.06.2019 22:10
Monitors manufactured by tsi electronics have life spans that have a normal distribution with a standard deviation of 1800 hours and a mean life span of 20,000 hours. if a monitor is selected at random, find the probability that the life span of the monitor will be more than 17,659 hours. round your answer to four decimal places.
Answers: 2
You know the right answer?
Questions


History, 13.11.2020 17:40

Arts, 13.11.2020 17:40


Health, 13.11.2020 17:40
History, 13.11.2020 17:40

Spanish, 13.11.2020 17:40
SAT, 13.11.2020 17:40
English, 13.11.2020 17:40
Mathematics, 13.11.2020 17:40
Biology, 13.11.2020 17:40
English, 13.11.2020 17:40
Mathematics, 13.11.2020 17:40


