158, 164, 146, 170, 165, 187, 164, 174, 186, 197
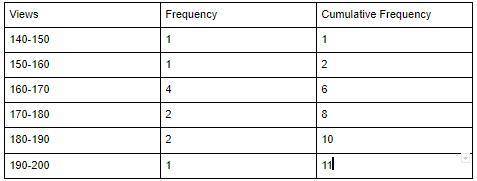
a. Create a frequency table to represent the...

Mathematics, 05.05.2020 03:54 kayladvine
158, 164, 146, 170, 165, 187, 164, 174, 186, 197
a. Create a frequency table to represent the data (2 points):
Number of Views:
Frequency:
b. Create a histogram to represent the data
c. Find the mean, median, mode, and range of the data. Round to the nearest tenth if
necessary
d. Find the minimum, first quartile, third quartile, and a maximum of the data. Round to the nearest tenth if necessary
e. Create a box-and-whisker plot to represent the data
f. Find the 40th percentile for the data set

Answers: 2


Another question on Mathematics
Mathematics, 21.06.2019 16:30
What is the name used to describe a graph where for some value of x, there exists 2 or more different values of y?
Answers: 2
Mathematics, 21.06.2019 19:00
Through non-collinear points there is exactly one plane.
Answers: 1
Mathematics, 21.06.2019 22:00
Which function in vertex form is equivalent to f(x) = x2 + 6x + 3? f(x) = (x + 3)2 + 3 f(x) = (x + 3)2 − 6 f(x) = (x + 6)2 + 3 f(x) = (x + 6)2 − 6
Answers: 1
Mathematics, 21.06.2019 23:00
Jim had 3,067.48 in his checking account he wrote a check to pay for two airplane tickets. his account now has 1,845.24.
Answers: 1
You know the right answer?
Questions

English, 07.12.2021 07:10
Mathematics, 07.12.2021 07:10
Mathematics, 07.12.2021 07:10

History, 07.12.2021 07:10


Geography, 07.12.2021 07:10
History, 07.12.2021 07:10
History, 07.12.2021 07:10
Mathematics, 07.12.2021 07:10

Social Studies, 07.12.2021 07:20


