


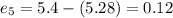
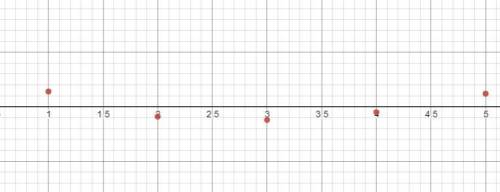
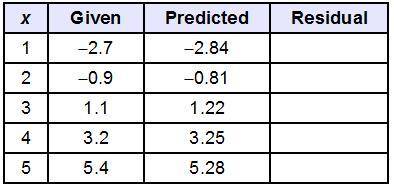
Find the residual values, and use the graphing calculator tool to make a residual plot.
...

Mathematics, 05.05.2020 09:49 okitsfrizz6366
Find the residual values, and use the graphing calculator tool to make a residual plot.
Does the residual plot show that the line of best fit is appropriate for the data?
No, the points are in a curved pattern.
No, the points are evenly distributed about the x-axis.
Yes, the points are in a linear pattern.
Yes, the points have no pattern.

Answers: 2


Another question on Mathematics
Mathematics, 21.06.2019 12:50
2-digit numbers less than 91 which are 1 less than a multiple of 10
Answers: 1
Mathematics, 21.06.2019 15:10
Drag each sequence of transformations to the correct location on the table. classify the sequences of transformations based on whether or not they prove the congruency of the shapes by mapping shape i onto shape ii. plz i'll rate u 5 stars need this done for a mastery test
Answers: 1
Mathematics, 21.06.2019 23:30
Hundred and tens tables to make 430 in five different ways
Answers: 1
Mathematics, 21.06.2019 23:30
Which graph represents the same relation is the sa which graph represents the same relation as the set {(-3-2)}
Answers: 3
You know the right answer?
Questions

Biology, 10.07.2019 03:30

Mathematics, 10.07.2019 03:30

Chemistry, 10.07.2019 03:30
Biology, 10.07.2019 03:30
Biology, 10.07.2019 03:30


