A1 B1 C1
A2 2 7 1
B2 2 10 3
C2 1 3 1
The table shows the...

Mathematics, 05.05.2020 23:39 lamanihill
A1 B1 C1
A2 2 7 1
B2 2 10 3
C2 1 3 1
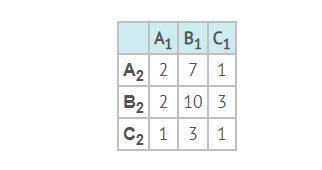
The table shows the number of students in a class that received letter grades on 2 recent exams. The first exam is shown across the top and is summarized as A1, B1, and C1, and the second exam is in the first column, A2, B2, and C2. Given that a student earns a B on the first exam, what is the probability the student earns a B on the second exam?
A) 25%
B) 33%
C) 50%
D) 67%

Answers: 1


Another question on Mathematics
Mathematics, 21.06.2019 17:20
Read the equations in the table below. then drag a description of the situation and a table to represent each equation. indicate whether each of the relationships is proportional or non-proportional.
Answers: 1
Mathematics, 21.06.2019 18:00
Express in the simplest form: (x^2+9x+14/x^2-49) / (3x+6/x^2+x-56)
Answers: 3
Mathematics, 21.06.2019 19:00
Jack did 3/5 of all problems on his weekend homework before sunday. on sunday he solved 1/3 of what was left and the last 4 problems. how many problems were assigned for the weekend?
Answers: 3
Mathematics, 21.06.2019 19:30
Agroup of randomly selected apple valley high school students were asked to pick their favorite gym class. the table below shows the results of the survey. there are 528 students at apple valley high school. gym class number of students racquet sports 1 team sports 9 track and field 17 bowling 13 based on the data, what is the most reasonable estimate for the number of students at apple valley high school whose favorite gym class is bowling? choose 1 answer a. 9 b. 13 c. 119 d. 172
Answers: 1
You know the right answer?
Questions
Mathematics, 06.06.2021 04:20


Mathematics, 06.06.2021 04:20

Biology, 06.06.2021 04:20
Spanish, 06.06.2021 04:20


English, 06.06.2021 04:20
Social Studies, 06.06.2021 04:20


