The following table represents a sample of sale prices, in thousands of dollars, and number of
...

Mathematics, 05.05.2020 23:43 kiaraahquin9546
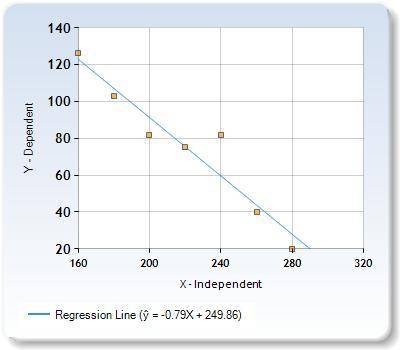
The following table represents a sample of sale prices, in thousands of dollars, and number of
new homes available at that price in 2017
160/180 | 200 | 220 | 240 | 26 |
280
Sale Price, p
(in thousands of dollars)
Number of New Homes Available
fip)
126
103
82
751
40
20

Answers: 2


Another question on Mathematics
Mathematics, 21.06.2019 20:30
Can someone me with #s 8, 9, and 11. with just one of the three also works. prove using only trig identities.
Answers: 3
Mathematics, 21.06.2019 21:00
Campus rentals rents 2 and 3 bedrooms apartments for $700 ans $900 a month respectively. last month they had six vacant apartments and reported $4600 in lost rent. how many of each type of apartment were vacant?
Answers: 1
Mathematics, 22.06.2019 02:20
If you draw a card with a value of three or less from a standard deck of cards, i will pay you $43. if not, you pay me $11. (aces are considered the highest card in the deck.) step 1 of 2 : find the expected value of the proposition. round your answer to two decimal places. losses must be expressed as negative values.
Answers: 2
Mathematics, 22.06.2019 02:30
Atrain traveled for 1.5 hours to the first station, stopped for 30 minutes, then traveled for 4 hours to the final station where it stopped for 1 hour. the total distance traveled is a function of time. which graph most accurately represents this scenario? a graph is shown with the x-axis labeled time (in hours) and the y-axis labeled total distance (in miles). the line begins at the origin and moves upward for 1.5 hours. the line then continues upward at a slow rate until 2 hours. from 2 to 6 hours, the line continues quickly upward. from 6 to 7 hours, it moves downward until it touches the x-axis a graph is shown with the axis labeled time (in hours) and the y axis labeled total distance (in miles). a line is shown beginning at the origin. the line moves upward until 1.5 hours, then is a horizontal line until 2 hours. the line moves quickly upward again until 6 hours, and then is horizontal until 7 hours a graph is shown with the axis labeled time (in hours) and the y-axis labeled total distance (in miles). the line begins at the y-axis where y equals 125. it is horizontal until 1.5 hours, then moves downward until 2 hours where it touches the x-axis. the line moves upward until 6 hours and then moves downward until 7 hours where it touches the x-axis a graph is shown with the axis labeled time (in hours) and the y-axis labeled total distance (in miles). the line begins at y equals 125 and is horizontal for 1.5 hours. the line moves downward until 2 hours, then back up until 5.5 hours. the line is horizontal from 5.5 to 7 hours
Answers: 1
You know the right answer?
Questions

Mathematics, 30.11.2021 20:50

Social Studies, 30.11.2021 20:50


Mathematics, 30.11.2021 20:50

Mathematics, 30.11.2021 21:00
SAT, 30.11.2021 21:00
Mathematics, 30.11.2021 21:00
History, 30.11.2021 21:00


