Activity
Genivieve and Mindy kept a record of how many ounces of water they drank each day. Th...

Mathematics, 06.05.2020 00:35 camiloriveraveoxbgd6
Activity
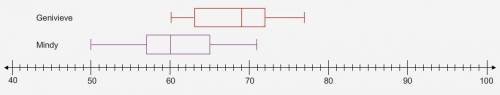
Genivieve and Mindy kept a record of how many ounces of water they drank each day. The two box plots represent the data they gathered.
In this activity, you'll use the data in the box plots to determine the medians and interquartile ranges. Then you’ll compare the values to assess the degree of overlap for the two data distributions.
Part A
What is the median amount of water (in ounces) that Genivieve drank per day?

Answers: 3


Another question on Mathematics
Mathematics, 21.06.2019 17:00
Consider the function represented by the equation 1/2 j + 1/4 k equals 3 which shows the equation written in function notation with j as the independent variable
Answers: 1
Mathematics, 21.06.2019 23:30
Hich equation can pair with x + 2y = 5 to create an inconsistent system? 2x + 4y = 3 5x + 2y = 3 6x + 12y = 30 3x + 4y = 8
Answers: 3
Mathematics, 22.06.2019 01:00
Find the center of the circle that can be circumscribed about efg with e(4,4) f(4,2) g(8,2)
Answers: 1
You know the right answer?
Questions


Health, 01.03.2021 20:30
Mathematics, 01.03.2021 20:30
Mathematics, 01.03.2021 20:30


Social Studies, 01.03.2021 20:30

Mathematics, 01.03.2021 20:30
Mathematics, 01.03.2021 20:30


Geography, 01.03.2021 20:30
Mathematics, 01.03.2021 20:30
Mathematics, 01.03.2021 20:30
Mathematics, 01.03.2021 20:30


