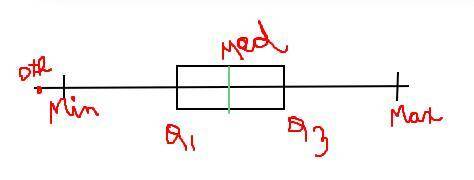
Which of the following is true of the data represented by the box plot?
box plot with po...

Mathematics, 06.05.2020 02:38 hall7948
Which of the following is true of the data represented by the box plot?
box plot with point at 15, min at 17, Q1 at 51, median at 65, Q3 at 74, max at 90
A) If the outlier is included in the data, the median would not significantly change.
B) If the outlier is included in the data, the mean would increase.
C) If the outlier is included in the data, the box plot would be significantly skewed.
D) If the outlier is included in the data, the length of the tails would change significantly.

Answers: 1


Another question on Mathematics
Mathematics, 21.06.2019 17:30
Write the fraction 9/50 as a decimal if needed round to the nearest hundredth
Answers: 2
Mathematics, 21.06.2019 18:00
What are the coordinates of the midpoint of ab? ,1/2) /2,-1) ,-3/2) /2,-2)
Answers: 1
Mathematics, 21.06.2019 22:00
The coordinates r(1, -3), s(3, -1) t(5, -7) form what type of polygon? a right triangle an acute triangle an equilateral triangle an obtuse triangle
Answers: 1
You know the right answer?
Questions


English, 06.03.2020 00:30

Mathematics, 06.03.2020 00:30


History, 06.03.2020 00:31

Computers and Technology, 06.03.2020 00:31

English, 06.03.2020 00:31


