24. SHORT ANSWER The line graph shows
the performance of a stock over a 5-day
period. Desc...

Mathematics, 19.05.2020 02:58 tiwaribianca475
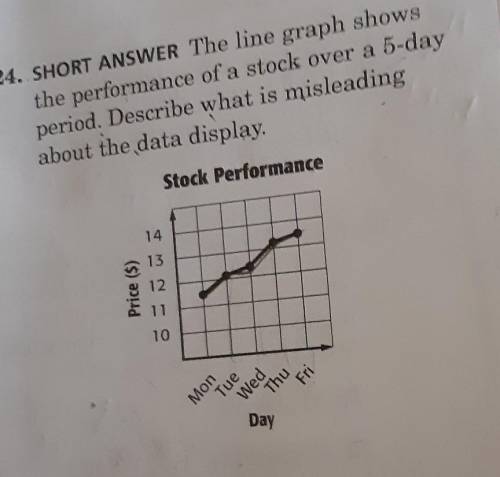
24. SHORT ANSWER The line graph shows
the performance of a stock over a 5-day
period. Describe what is misleading
about the data display,
Stock Performance

Answers: 1


Another question on Mathematics
Mathematics, 21.06.2019 14:00
If x = 12 and y = 3, what is the value of x - y 2? 81 6 3 18
Answers: 1
Mathematics, 21.06.2019 16:20
Refer to interactive solution 17.45 to review a method by which this problem can be solved. the fundamental frequencies of two air columns are the same. column a is open at both ends, while column b is open at only one end. the length of column a is 0.504 m. what is the length of column b?
Answers: 1
Mathematics, 21.06.2019 19:00
The length of a rectangular piece of land is 92 yards more than three times its width. the perimeter is 760 yards. find its dimensions.
Answers: 1
Mathematics, 21.06.2019 23:00
Given the expression (7 ? 4i) ? (2 + 6i), perform the indicated operation and write the answer in the form a + bi.
Answers: 1
You know the right answer?
Questions


Spanish, 22.03.2020 23:33
Mathematics, 22.03.2020 23:33
Mathematics, 22.03.2020 23:33
Mathematics, 22.03.2020 23:34

Health, 22.03.2020 23:34

Mathematics, 22.03.2020 23:34


Mathematics, 22.03.2020 23:35
Mathematics, 22.03.2020 23:35


