
Mathematics, 19.05.2020 23:45 dustysorrells74
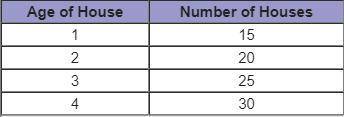
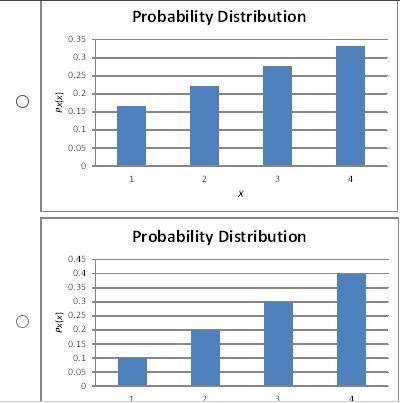
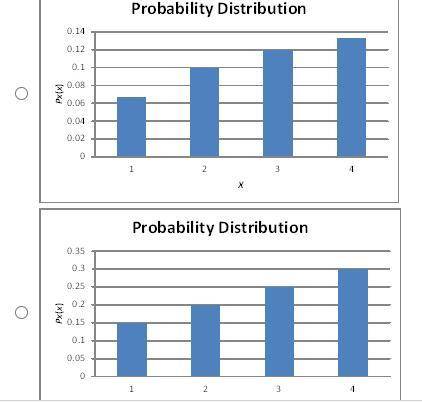
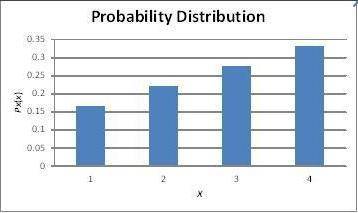
The table below shows the ages of houses to the nearest year in a neighborhood. Using the age of the houses as the random variable, X, which graph shows the probability distribution, PX(x), of a randomly chosen house? HURRY

Answers: 2


Another question on Mathematics
Mathematics, 21.06.2019 18:00
10 ! a train starts from grand city and travels toward belleville 388 miles away. at the same time, a train starts from belleville and runs at the rate of 47 miles per hour toward grand city. they pass each other 4 hours later. find the rate of the train from grand city.
Answers: 1
Mathematics, 21.06.2019 22:00
In dire need~! describe how to use area models to find the quotient 2/3 divided by 1/5. check your work by also finding the quotient 2/3 divided by 1/5 using numerical operations only.
Answers: 3
Mathematics, 22.06.2019 01:20
Consider the image of klmn for the translation (x, y) → (x – 2, y – 1). what is the ordered pair of l′?
Answers: 1
Mathematics, 22.06.2019 02:30
An ice cream shop sells 5 times as many cakes cones as waffle cones. use x to represent the number of waflle cones the ice cream shop sells and use the variable to write an expresion for the number of cake cones the ice cream shop sells. enter the expression for the number of cake cones the the ice cream shop sells
Answers: 3
You know the right answer?
The table below shows the ages of houses to the nearest year in a neighborhood. Using the age of the...
Questions
Mathematics, 07.12.2020 18:40
Mathematics, 07.12.2020 18:40
Mathematics, 07.12.2020 18:40

Mathematics, 07.12.2020 18:40

Mathematics, 07.12.2020 18:40

Social Studies, 07.12.2020 18:40

Mathematics, 07.12.2020 18:40
Mathematics, 07.12.2020 18:40
Mathematics, 07.12.2020 18:40
Mathematics, 07.12.2020 18:40

Chemistry, 07.12.2020 18:40
Mathematics, 07.12.2020 18:40
Mathematics, 07.12.2020 18:40


