
Mathematics, 21.05.2020 23:59 daisa02
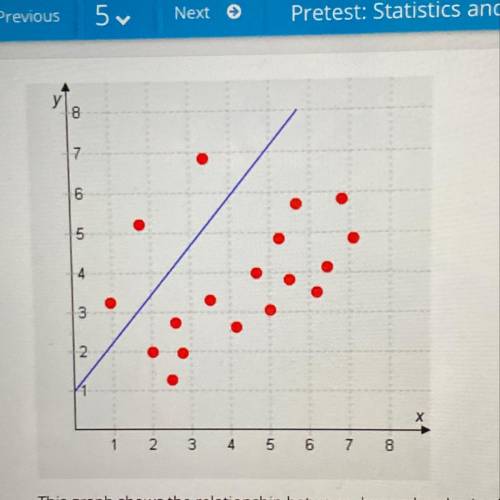
This graph shows the relationship between demand and price for goods sold at a shop. Anna plots the data on a scatter plot and draws a line of best fit to represent the relationship as shown. This is not the line of best fit because the line _. Anna could get a better fit by _ the y-intercept and _ the slope

Answers: 1


Another question on Mathematics
Mathematics, 21.06.2019 14:30
Describe in detail how you would construct a 95% confidence interval for a set of 30 data points whose mean is 20 and population standard deviation is 3. be sure to show that you know the formula and how to plug into it. also, clearly state the margin of error.
Answers: 3
Mathematics, 21.06.2019 22:30
Which of the following would be a reasonable estimate for the weight of a pencil? a. 1 × 10^-20 lb b. 1 × 10^20 lb c. 1 × 10^2 lb d. 1 × 10^-2 lb
Answers: 1
Mathematics, 22.06.2019 04:00
Rewrite the point-slope equation in slope-intercept form: y - 3 = 2(x + 4)
Answers: 2
Mathematics, 22.06.2019 06:00
Sakura speaks 150 words per minute on average in hungarian, and 190 words per minute on average in polish. she once gave cooking instructions in hungarian, followed by cleaning instructions in polish. sakura pent 5 minutes total giving both instructions, and spoke 270 more words in polish than in hungaria how long did sakura speak in hungarian, and how long did she speak in polish? sakura spoke for minutes in hungarian and for minutes in polish
Answers: 3
You know the right answer?
This graph shows the relationship between demand and price for goods sold at a shop. Anna plots the...
Questions
Mathematics, 19.11.2020 17:40

English, 19.11.2020 17:40


Mathematics, 19.11.2020 17:40
Mathematics, 19.11.2020 17:40

Biology, 19.11.2020 17:40
Mathematics, 19.11.2020 17:40

Law, 19.11.2020 17:40
Biology, 19.11.2020 17:40

Business, 19.11.2020 17:40
English, 19.11.2020 17:40
Mathematics, 19.11.2020 17:40


