
Mathematics, 21.05.2020 08:58 Carri425
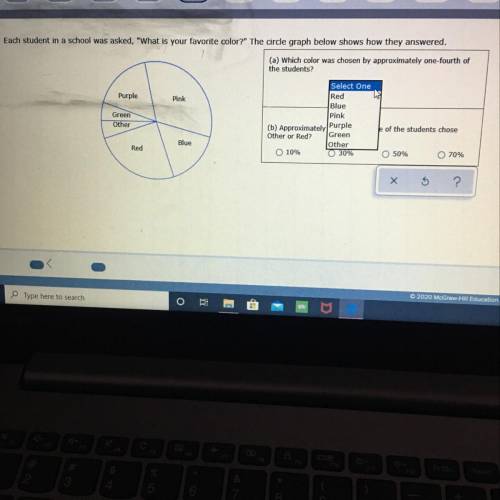
Each student in a school was asked, "What is your favorite color?" The circle graph below shows how they answered.
(a) Which color was chosen by approximately one-fourth of
the students?
(b) Approximately what percentage of the students chose Other or Red?

Answers: 3


Another question on Mathematics
Mathematics, 21.06.2019 19:00
1) in triangle the, what is the measure of angle t (in degrees)? 2) in triangle bat, the measure of angle b is 66∘, and the measure of angle t is 77∘.what is the measure of the exterior angle at a (in degrees)?
Answers: 1
Mathematics, 21.06.2019 19:00
Asmall business produces and sells balls. the fixed costs are $20 and each ball costs $4.32 to produce. each ball sells for $8.32. write the equations for the total cost, c, and the revenue, r, then use the graphing method to determine how many balls must be sold to break even.
Answers: 3
Mathematics, 21.06.2019 19:30
The amount spent on food and drink by 20 customers is shown below what is the modal amount spent and the median? 40 25 8 36 18 15 24 27 43 9 12 19 22 34 31 20 26 19 17 28
Answers: 1
Mathematics, 21.06.2019 22:20
Which graph represents the given linear function 4x+2y=3
Answers: 1
You know the right answer?
Each student in a school was asked, "What is your favorite color?" The circle graph below shows how...
Questions

Health, 10.12.2021 02:40
Mathematics, 10.12.2021 02:40


English, 10.12.2021 02:40

Biology, 10.12.2021 02:40

Spanish, 10.12.2021 02:40
Mathematics, 10.12.2021 02:40
Biology, 10.12.2021 02:40

Mathematics, 10.12.2021 02:40
Health, 10.12.2021 02:40
English, 10.12.2021 02:40


Biology, 10.12.2021 02:40


