
Mathematics, 22.05.2020 13:58 nikki225
HELP PLEASE! I know someone else has answered this before but I'm so confused about how they came up with it PLEASE HELP!
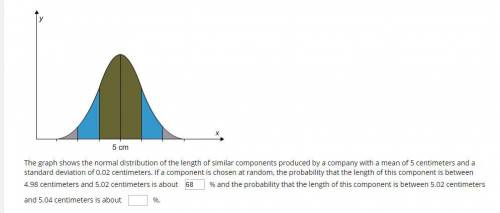
The graph shows the normal distribution of the length of similar components produced by a company with a mean of 5 centimeters and a standard deviation of 0.02 centimeters. If a component is chosen at random, the probability that the length of this component is between 4.98 centimeters and 5.02 centimeters is about

Answers: 3


Another question on Mathematics
Mathematics, 21.06.2019 17:00
Describe what moves you could use to create the transformation of the original image shown at right
Answers: 1
Mathematics, 22.06.2019 00:00
Last week jason walked 3 1/4 miles each day for 3 days and 4 5/8 miles each day for 4 days. about how many miles did jason walk last week?
Answers: 1
Mathematics, 22.06.2019 02:00
Estimate the time en route from majors airport (area 1) to winnsboro airport (area 2). the wind is from 340° at 12 knots and the true airspeed is 136 knots. magnetic variation is 5° east.
Answers: 2
Mathematics, 22.06.2019 03:00
The hockey team has been great! in 2008 they won 20% more games than in 2007. in 2009 they won 50% more games than in 2008. what was their overall percentage increase from 2007 through 2009?
Answers: 2
You know the right answer?
HELP PLEASE! I know someone else has answered this before but I'm so confused about how they came up...
Questions

Mathematics, 28.01.2021 23:30
Mathematics, 28.01.2021 23:30
Mathematics, 28.01.2021 23:30
Mathematics, 28.01.2021 23:30
Mathematics, 28.01.2021 23:30

Mathematics, 28.01.2021 23:30

Biology, 28.01.2021 23:30
Mathematics, 28.01.2021 23:30


