
Mathematics, 22.05.2020 21:04 dedrenabouyer
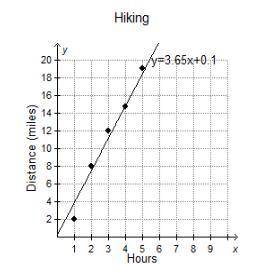
The graph shows the best-fit regression model for a set of data comparing the number of hours spent hiking and the number of miles traveled in one day.
A) Each point in the data set falls on the regression line.
B) The regression model is an accurate representation of the distance for any number of hours hiked.
C) Each point in the data set is near the regression line.
D) The regression model is inaccurate, as it does not begin at (0, 0).

Answers: 1


Another question on Mathematics
Mathematics, 21.06.2019 20:00
Aball is dropped from a height of 10m above the ground. it bounce to 90% of its previous height on each bounce. what is the approximate height that the ball bounce to the fourth bounce?
Answers: 2
Mathematics, 21.06.2019 20:40
Lines a and b are parallel. what is the value of x? -5 -10 -35 -55
Answers: 2
Mathematics, 22.06.2019 00:40
Find the volume of the solid bounded by the plane z=0 and the paraboloid z=1-x^2 –y^2
Answers: 1
You know the right answer?
The graph shows the best-fit regression model for a set of data comparing the number of hours spent...
Questions

Mathematics, 30.11.2020 23:00

Social Studies, 30.11.2020 23:00

History, 30.11.2020 23:00

Mathematics, 30.11.2020 23:00
Social Studies, 30.11.2020 23:00
English, 30.11.2020 23:00
Mathematics, 30.11.2020 23:00

Business, 30.11.2020 23:00


