
Mathematics, 22.05.2020 21:08 therealnana
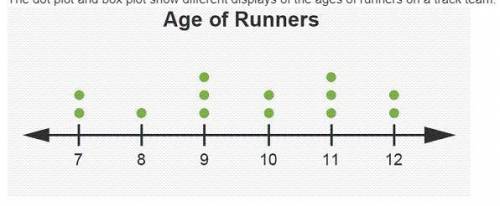
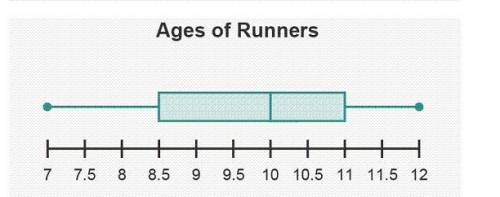
The dot plot and box plot show different displays of the ages of runners on a track team.
Which statements best describe the dot plot or box plot? Check all that apply.
1.) Add the number of dots above each age in the dot plot to find the number of players on the team: 2 + 1 + 3 + 2 + 3 + 2 = 13.
2.) Subtract the maximum and minimum values of the box plot to find the number of players on the team: 12 – 7.
3.) The median appears clearly on the dot plot at the center of the number line: 9.5. 4.) The median appears clearly on the box plot at the line within the box: 10.
5.) The dot plot is the only display that can be used to show the variability of the data. 6.) The box plot is the only display that can be used to show the variability of the data.
Please answer quickly.

Answers: 1


Another question on Mathematics
Mathematics, 21.06.2019 14:00
Ms. sutton recorded the word counts and scores of the top ten essays in a timed writing contest. the table shows her data. how does the word count of an essay relate to its score in the contest? word count tends to decrease as the score decreases. word count tends to increase as the score decreases. word count tends to remain constant as the score decreases. word count has no apparent relationship to the score of the essay.
Answers: 1
Mathematics, 21.06.2019 21:50
What is the 17th term in the arithmetic sequence in which a6 is 101 and a9 is 83
Answers: 3
Mathematics, 21.06.2019 23:20
Question 4 of 102 pointsjuliana had $96, which is eight times as much money as al had. how mucmoney did al have? select the correct solution method below, representingals money with x.
Answers: 2
You know the right answer?
The dot plot and box plot show different displays of the ages of runners on a track team.
Questions
Mathematics, 27.06.2019 09:50

Biology, 27.06.2019 09:50
Mathematics, 27.06.2019 09:50

History, 27.06.2019 09:50
Biology, 27.06.2019 09:50


Biology, 27.06.2019 09:50

Social Studies, 27.06.2019 09:50
Social Studies, 27.06.2019 09:50
Mathematics, 27.06.2019 09:50


