
Mathematics, 22.05.2020 22:01 lorraneb31
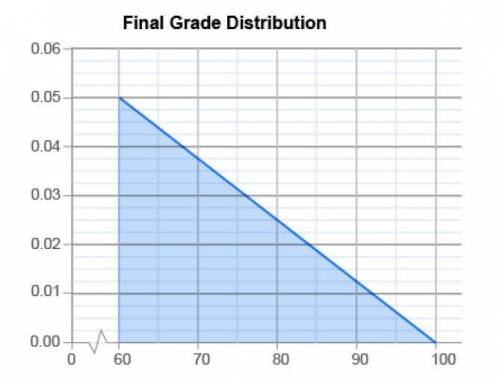
Mrs. Adams just gave the final exam for the Government course she teaches. Here's the density graph of the distribution of scores students earned on her final.
What is the probability of randomly choosing a student who scored 80% or less? A. 0.05 B. 0.25 C. 0.50 D. 0.75
What is the probability of randomly choosing a student who scored 70% or more? A. 0.4 B. 0.445 C. 0.5 D. 0.5625
What is the probability of randomly choosing a student who scored between 70% and 80%? A. 0.25 B. 0.3125 C. 0.45 D. 0.555

Answers: 1


Another question on Mathematics
Mathematics, 21.06.2019 14:30
What is the order of operations for 2 + (3 - 9) ÷ -3 · 4 in number order 1. subtraction 2. division 3. addition 4. multiplication
Answers: 1
Mathematics, 21.06.2019 17:00
Which measure is equivalent to 110 ml? 0.0110 l 0.110 l 1.10 l 11,000 l
Answers: 2
Mathematics, 21.06.2019 19:20
Thompson and thompson is a steel bolts manufacturing company. their current steel bolts have a mean diameter of 127 millimeters, and a variance of 36. if a random sample of 35 steel bolts is selected, what is the probability that the sample mean would differ from the population mean by greater than 0.5 millimeters? round your answer to four decimal places.
Answers: 3
Mathematics, 21.06.2019 19:30
According to the data set, where should the upper quartile line of the box plot be placed?
Answers: 1
You know the right answer?
Mrs. Adams just gave the final exam for the Government course she teaches. Here's the density graph o...
Questions


Computers and Technology, 21.04.2020 00:57

English, 21.04.2020 00:57

Biology, 21.04.2020 00:57

Mathematics, 21.04.2020 00:57
Biology, 21.04.2020 00:57

Mathematics, 21.04.2020 00:57

Physics, 21.04.2020 00:57


