
Mathematics, 22.05.2020 19:07 yennie123
A museum recorded the numbers of visitors they had each day for a month. The table below shows the results.
What type of display would be best to use for this information?
A. line graph
B. histogram
C. double bar graph
D. circle graph

Answers: 1


Another question on Mathematics
Mathematics, 21.06.2019 16:30
Arandom sample of 150 high school students were asked whether they have a job. the results are shown in the table. have a job do not have a job male 48 35 female 41 26 select a ord or phrase from the drop-down menus to correctly complete the statements describing the association.
Answers: 1
Mathematics, 21.06.2019 17:30
Lems1. the following data set represents the scores on intelligence quotient(iq) examinations of 40 sixth-grade students at a particular school: 114, 122, 103, 118, 99, 105, 134, 125, 117, 106, 109, 104, 111, 127,133, 111, 117, 103, 120, 98, 100, 130, 141, 119, 128, 106, 109, 115,113, 121, 100, 130, 125, 117, 119, 113, 104, 108, 110, 102(a) present this data set in a frequency histogram.(b) which class interval contains the greatest number of data values? (c) is there a roughly equal number of data in each class interval? (d) does the histogram appear to be approximately symmetric? if so,about which interval is it approximately symmetric?
Answers: 3
Mathematics, 21.06.2019 18:00
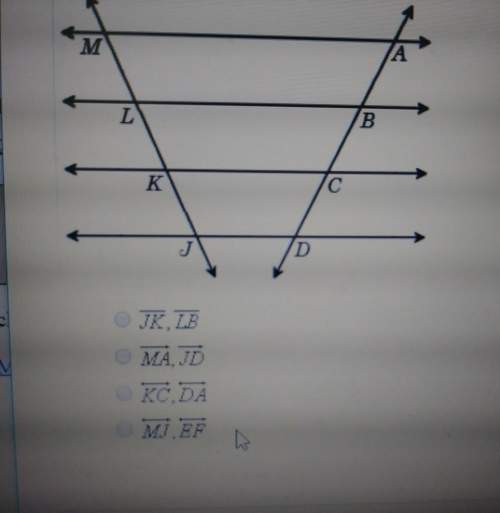
List the sides of δrst in in ascending order (shortest to longest) if: a ∠r =x+28°, m∠s = 2x+16°, and m∠t = x+12°
Answers: 2
Mathematics, 21.06.2019 21:00
Joanie watched 1 out of three of a movie in the morning
Answers: 1
You know the right answer?
A museum recorded the numbers of visitors they had each day for a month. The table below shows the r...
Questions


Social Studies, 29.07.2019 15:00
Geography, 29.07.2019 15:00

Advanced Placement (AP), 29.07.2019 15:00
History, 29.07.2019 15:00
Mathematics, 29.07.2019 15:00


