Mathematics, 23.05.2020 19:57 zacharysharpe2805
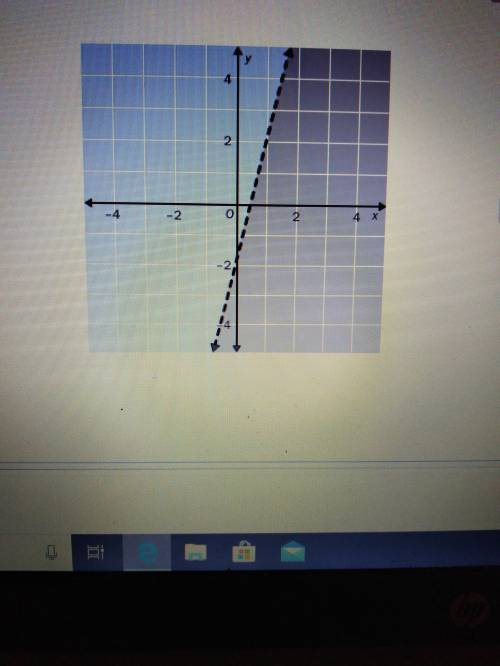
Choose the linear inequality that describes the graph. The gray area represents the shaded region.
A. y ≤ -4x - 2 , B. y > -4x -2 , C. y ≥ -4x - 2 , D. y < 4x -2


Answers: 1


Another question on Mathematics

Mathematics, 21.06.2019 13:40
Desmond wants to sell his car that he paid $8,000 for 2 years ago. the car depreciated, or decreased in value, at a constant rate each month over a 2-year period. if x represents the monthly depreciation amount, which expression shows how much desmond can sell his car for today? 8,000 + 24x 8,000 − 24x 8,000 + 2x 8,000 − 2x
Answers: 1

Mathematics, 21.06.2019 19:00
Define multiplicative inverse. give an example of a number and its multiplicative inverse.
Answers: 1

Mathematics, 21.06.2019 22:30
Which term below correctly completes the following sentence? if a function has a vertical asymptote at a certain x value, then the function is what at that value
Answers: 1

You know the right answer?
Choose the linear inequality that describes the graph. The gray area represents the shaded region. <...
Questions


Mathematics, 07.12.2021 05:50


Computers and Technology, 07.12.2021 05:50


Mathematics, 07.12.2021 05:50


Health, 07.12.2021 05:50

Social Studies, 07.12.2021 05:50


Mathematics, 07.12.2021 05:50

Mathematics, 07.12.2021 05:50


Mathematics, 07.12.2021 05:50

Mathematics, 07.12.2021 05:50


