
Mathematics, 23.05.2020 11:57 yousuasgha5705
The graph below shows the average daily temperatures on January 1 from 1900 to 1934 for city A.
The mean of the temperatures in the chart is 24° with standard deviation of 4°. How many years had temperatures within one standard deviation of the mean?
20
25
28
35
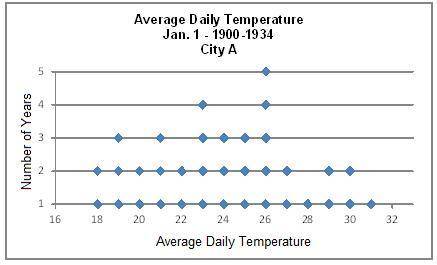

Answers: 2


Another question on Mathematics
Mathematics, 22.06.2019 02:00
Acompany had forty one employees and ordered nine hundred eighty uniforms for them. if they wanted to give each employees the same number of uniforms, how many more uniforms should they order so they don't have any extra
Answers: 1
Mathematics, 22.06.2019 03:00
Alayna wonders how much water it would take to fill her cup she drops her pencil in her cup and notices that it just fits diagonal the pencil is 17 cm long and the cup is 15 cm tall how much water can the cup hold
Answers: 2
Mathematics, 22.06.2019 03:00
Pleas ! i just cant seem to get it right! choose: congruent or proportional choose: cf or ce or bc choose: segment addition postulate or cpctc
Answers: 3
Mathematics, 22.06.2019 03:40
Analyze the solution below. 7 3 x = −2 7 3 x(3 7 ) = −2(3 7 ) x = − 6 7 what property was used to solve the equation? property of opposites division property of equality addition property of equality multiplication property of equality
Answers: 1
You know the right answer?
The graph below shows the average daily temperatures on January 1 from 1900 to 1934 for city A.
Questions
Mathematics, 16.11.2020 19:30


Mathematics, 16.11.2020 19:30
Mathematics, 16.11.2020 19:30
English, 16.11.2020 19:30

Computers and Technology, 16.11.2020 19:30
Mathematics, 16.11.2020 19:30

History, 16.11.2020 19:30

Mathematics, 16.11.2020 19:30


