
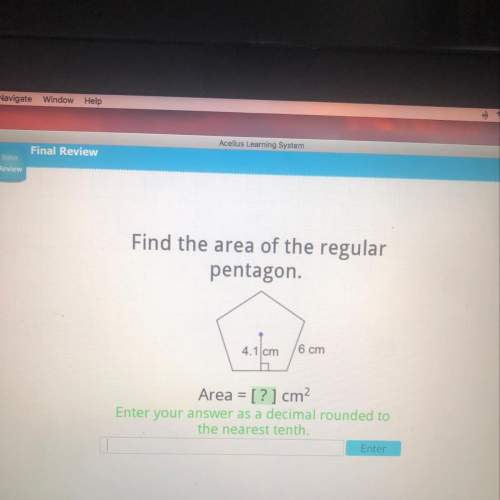
Mathematics, 24.05.2020 04:58 scottykinkade7860
Eight people were asked what the balance of their savings account at the beginning of the month was and how much it increased or decreased by the end of the month.
Create a scatter plot that represents the data that is shown in the table. The x-axis represents the beginning balance in thousands of dollars and the y-axis represents the change in the savings account in hundreds of dollars.
Name
Beginning balance
(in thousands of dollars)
Change in savings account
(in hundreds of dollars)
Jimmy 5 3
Kendra 4 7
Carlos 5 4
Yolanda 3 1
Shawn 2 5
Laura 3 2
Andy 5 6
Georgia 4 3

Answers: 2


Another question on Mathematics
Mathematics, 21.06.2019 15:50
Which formula finds the probability that a point on the grid below will be in the blue area? p(blue) = total number of squares number of blue squares number of blue squares p(blue) = total number of squares number of blue squares p(blue) = number of white squares
Answers: 1
Mathematics, 21.06.2019 17:30
Which equation represents a line that is parallel to the line whose equation is 3x-2y=7( show all work)
Answers: 3
Mathematics, 21.06.2019 20:00
How long does it take natsumi to clean up after she is done? table: .area time30. 245. 2.7560. 3.5
Answers: 2
Mathematics, 21.06.2019 20:20
Which of the following values are in the range of the function graphed below? check all that apply ! - will give the answer "brainliest! "
Answers: 1
You know the right answer?
Eight people were asked what the balance of their savings account at the beginning of the month was...
Questions
Mathematics, 10.03.2021 22:10
Mathematics, 10.03.2021 22:10
Mathematics, 10.03.2021 22:10

Mathematics, 10.03.2021 22:10
Mathematics, 10.03.2021 22:10
Mathematics, 10.03.2021 22:10
Mathematics, 10.03.2021 22:10
Mathematics, 10.03.2021 22:10
Mathematics, 10.03.2021 22:10

Mathematics, 10.03.2021 22:10
Mathematics, 10.03.2021 22:10


