
Mathematics, 24.05.2020 06:00 ogsmash81
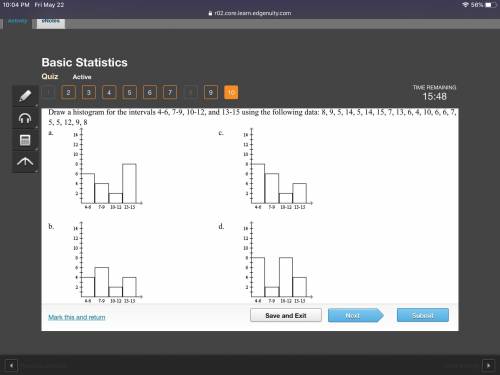
Draw a histogram for the intervals 4-6, 7-9, 10-12, and 13-15 using the following data: 8, 9, 5, 14, 5, 14, 15, 7, 13, 6, 4, 10, 6, 6, 7, 5, 5, 12, 9, 8

Answers: 2


Another question on Mathematics
Mathematics, 21.06.2019 13:30
David bought a poster for an art project. the poster is 2.7 feet wide and 3.9 feet tall. what is the area of the poster?
Answers: 2
Mathematics, 21.06.2019 19:00
Explain why the factor 1.5 is broke. into two numbers in the model.
Answers: 3
Mathematics, 21.06.2019 19:30
Prove the divisibility of the following numbers: 25^9 + 5^7 is divisible by 30.also, read as (25 to the power of 9) + (5 to the power of 7) is divisible by 30. blank x 30what is the blank? ( it should be expressed in exponent form)
Answers: 1
Mathematics, 21.06.2019 22:30
What would be the reasons for lines 3 and 4? a. addition property; subtraction property b. addition property; solve c. substitution property; subtraction property d. substitution property; prove
Answers: 1
You know the right answer?
Draw a histogram for the intervals 4-6, 7-9, 10-12, and 13-15 using the following data: 8, 9, 5, 14,...
Questions
Mathematics, 24.08.2021 14:00
Mathematics, 24.08.2021 14:00

Mathematics, 24.08.2021 14:00
Mathematics, 24.08.2021 14:00


English, 24.08.2021 14:00

Computers and Technology, 24.08.2021 14:00
Computers and Technology, 24.08.2021 14:00
Mathematics, 24.08.2021 14:00
Mathematics, 24.08.2021 14:00
English, 24.08.2021 14:00

Arts, 24.08.2021 14:00
Mathematics, 24.08.2021 14:00


