
Mathematics, 24.05.2020 23:58 melanie1055
Find the residual values, and use the graphing calculator tool to make a residual plot. (Table attached below)
Does the residual plot show that the line of best fit is appropriate for the data?
A) No, the points are in a curved pattern.
B) No, the points are evenly distributed about the x-axis.
C) Yes, the points are in a linear pattern.
D) Yes, the points have no pattern.
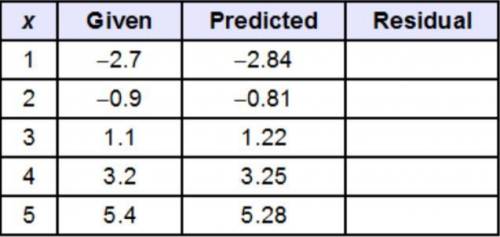

Answers: 3


Another question on Mathematics
Mathematics, 21.06.2019 17:20
What other information do you need to prove triangle dac=bca by asa
Answers: 1
Mathematics, 21.06.2019 18:30
The formula for the lateral area of a right cone is la = rs, where r is the radius of the base and s is the slant height of the cone.which are equivalent equations?
Answers: 3
Mathematics, 21.06.2019 18:30
Select the lengths in centimeters that would form a right triangle
Answers: 1
Mathematics, 21.06.2019 19:00
Marina baked cookies. she gave 3/4 of the cookies to the scout bake sale. she shared the remaining 6 cookies with her friends. how many cookies did marina bake?
Answers: 3
You know the right answer?
Find the residual values, and use the graphing calculator tool to make a residual plot. (Table attac...
Questions

SAT, 14.11.2021 14:00


Chemistry, 14.11.2021 14:00

History, 14.11.2021 14:00
History, 14.11.2021 14:00


Social Studies, 14.11.2021 14:00

Mathematics, 14.11.2021 14:00

Chemistry, 14.11.2021 14:00
Social Studies, 14.11.2021 14:00


