
Mathematics, 25.05.2020 02:58 hargunk329
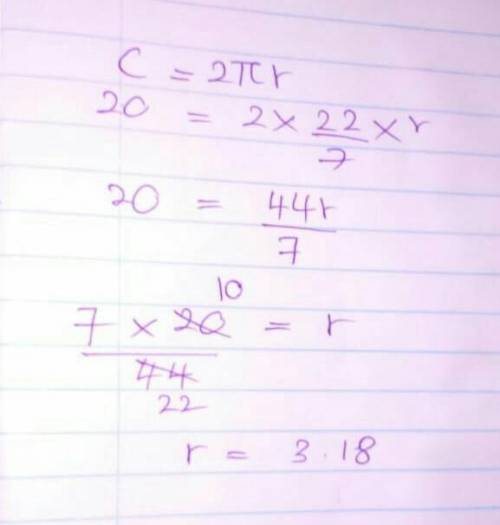
The circumference of a circle is 20 cm. What is the approximate radius of the circle?

Answers: 3


Another question on Mathematics
Mathematics, 21.06.2019 19:00
What are the solutions of the system? solve by graphing. y = -x^2 - 3x + 2 y = -2x + 2
Answers: 1
Mathematics, 21.06.2019 19:00
This task builds on important concepts you've learned in this unit and allows you to apply those concepts to a variety of situations. the task has several parts, each in its own section. mr. hill's seventh grade math class has been learning about random sampling and how it tends to produce samples that are representative of an entire population. they've also learned that if a sample is representative of the entire population, then estimates or predictions made based on the sample usually apply to the population as well. today, in class, they are also learning about variation in random sampling. that, although predictions and estimates about the population can be made from a random sample, different random samples will often produce slightly different predictions or estimates. to demonstrate this concept to his students, mr. hill is going to use simulation. he begins the lesson by explaining to the class that a certain university in the united states has a student enrollment of 19,100. mr. hill knows the percentage of students that are male and the percentage of students that are female. using simulation and random sampling, he wants his seventh grade students to estimate both the percentage of male students and the number of male students that are enrolled in this university. to conduct the simulation, mr. hill has placed one hundred colored chips in a bag, using the appropriate percentages of enrolled male and female university students. red chips represent males, and yellow chips represent females. each seventh grade student will randomly select twenty chips, record the colors they selected, and put the chips back in the bag. at this point, each seventh grade student will only know the results of their own random sample. before you begin, it's a good idea to look over each part to get oriented to the whole task. additionally, it's best to complete the sections in order, since they build on each other. finally, the work you complete will be a combination of computer-graded problems and written work that your teacher will grade. in some cases, you will need to complete work outside of the problem (in a word processing document or on paper, for example) and upload it for grading. to get started click work on questions. questions: 1. suppose a student reaches in the bag and randomly selects nine red chips and eleven yellow chips. based on this sample, what is a good estimate for the percentage of enrolled university students that are male? 2. suppose a student reaches in the bag and randomly selects nine red chips and eleven yellow chips. based on this sample, what is a good estimate for the number of enrolled university students that are male? 3. suppose a different student reaches in the bag, randomly selects their twenty chips, and estimates that 60% of the students are male. how many yellow chips were in their sample? 4. suppose a different student reaches in the bag, randomly selects their twenty chips, and estimates that 60% of the students are male. based on this sample, what is a good estimate for the number of enrolled university students that are female? 5. based on your dot plot, make a new estimate of both the percentage and number of males that attend this university. use complete sentences in your answer and explain your reasoning. 6. compare your estimates for the percentage of male university students from part a and part b. which estimate do you think is more representative of the population? use complete sentences in your answer and explain your reasoning. 7. once you have created both sets of numbers, complete the following tasks. in each task, make sure to clearly label which set you are identifying or describing. identify the elements of each set that you created. calculate the mean of each set. show your work in your answer. calculate the mean absolute deviation of each set. show your work in your answer. describe the process you used to create your sets of numbers under the given conditions.
Answers: 1
Mathematics, 21.06.2019 23:40
Type the correct answer in the box. use numerals instead of words. if necessary, use / for the fraction bar.a city water tank holds 20 gallons of water. a technician empties 25% of the tank. how many more gallons of water must be removed from thetank so that it has 5 of the water that it started with: the technician must removemore gallons of water for the tank to have 5 of the water that it started with.
Answers: 1
Mathematics, 22.06.2019 02:00
My final challenge question of the day! i have no tests, nothing to do this for, it is simply giving away free points for a you tube video! so 50 free points for answering the most simple question ever! here is the key to getting brainiest for this question. answer in under 50 seconds. you think you can do it. i think you can. here is the question: 1x2= i know! easiest question ever! and yes! if you answer this question, you will be on you so come on and get the free 50 while you can!
Answers: 2
You know the right answer?
The circumference of a circle is 20 cm. What is the approximate radius of the circle?...
Questions


English, 29.01.2020 10:47

Mathematics, 29.01.2020 10:47

History, 29.01.2020 10:47
History, 29.01.2020 10:47

Advanced Placement (AP), 29.01.2020 10:47
Mathematics, 29.01.2020 10:47
History, 29.01.2020 10:47


