
Question 1
The table and graph represent two different bus tours,
showing the cost as a...

Mathematics, 26.05.2020 05:58 probro1167
Question 1
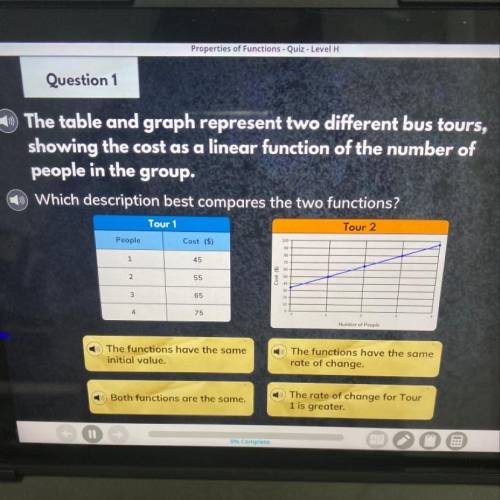
The table and graph represent two different bus tours,
showing the cost as a linear function of the number of
people in the group.
Whích description best compares the two functions?
Tour 1
Tour 2
People)
Cost (5)
2
3
69
6
75
The functions have the same
initial value.
The functions have the same
rate of change
Both functions are the same.
The rate of change for Tour
1 is greater

Answers: 2


Another question on Mathematics
Mathematics, 21.06.2019 14:00
Which expression is equivalent to? assume x > 0 and y > 0.
Answers: 1
Mathematics, 21.06.2019 18:00
What is the location of point g, which partitions the directed line segment from d to f into a 5: 4 ratio? –1 0 2 3
Answers: 1
Mathematics, 21.06.2019 18:40
The vertex of this parabola is at (-2,-3). when the x-value is -1, the y-value is -5. what is the coefficient of the squared expression in the parabola's equation?
Answers: 2
You know the right answer?
Questions


Computers and Technology, 11.03.2020 00:29
Mathematics, 11.03.2020 00:29


Computers and Technology, 11.03.2020 00:29


Mathematics, 11.03.2020 00:30

History, 11.03.2020 00:30


