A frequency table for the 30 best lifetime baseball
batting averages of all time is shown to t...

Mathematics, 25.05.2020 06:57 snikergrace
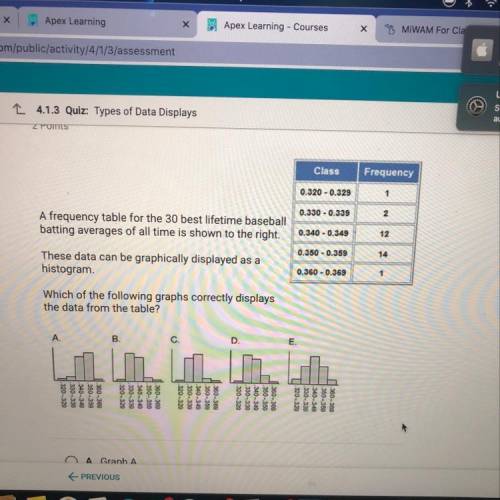
A frequency table for the 30 best lifetime baseball
batting averages of all time is shown to the right.
These data can be graphically displayed as a
histogram
Which of the following graphs correctly displays
the data from the table?

Answers: 1


Another question on Mathematics
Mathematics, 21.06.2019 18:30
Write the slope-intercept form of the line that passes through the point (1, 0) and is parallel to x - y = 7. t
Answers: 2
Mathematics, 21.06.2019 21:00
You buy five cds at a sale for $5.95 each. write an expression for the total cost of the cds.then use the distributive property and mental math to evaluate the expression.
Answers: 2
Mathematics, 21.06.2019 21:00
*let m∠cob = 50°30’, m∠aob = 70° and m∠aoc = 20°30’. could point c be in the interior of ∠aob? why?
Answers: 1
Mathematics, 21.06.2019 22:00
You can ride your bike around your block 6 times and the whole neighborhood 5 times in 16 minutes. you can ride your bike around your block 3 times and the whole neighborhood 10 times in 23 minutes. how long does it take you to ride around the neighborhood?
Answers: 2
You know the right answer?
Questions


Mathematics, 05.10.2019 17:30
Mathematics, 05.10.2019 17:30


Mathematics, 05.10.2019 17:30

Biology, 05.10.2019 17:30

Advanced Placement (AP), 05.10.2019 17:30
Mathematics, 05.10.2019 17:30


