The graph of F(x), shown below, resembles the graph of G(x) = x2, but it has
been stretched so...

Mathematics, 27.05.2020 06:57 nila49
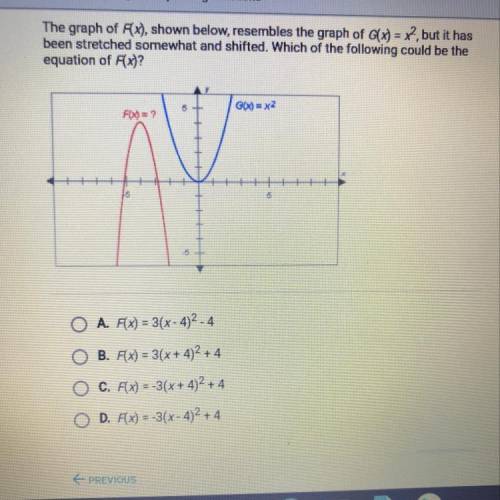
The graph of F(x), shown below, resembles the graph of G(x) = x2, but it has
been stretched somewhat and shifted. Which of the following could be the
equation of F(x)? A. F(x) = 3(x-4)2-4 B. F(x) = 3(x+4)2 + 4
C. F(x) = -3(x+4)2 + 4
D. F(x) = -3(x-4)2 + 4

Answers: 1


Another question on Mathematics
Mathematics, 21.06.2019 19:00
What is the correlation coefficient between the variables? round to three decimal places. enter your answer in the box
Answers: 2
Mathematics, 21.06.2019 20:00
Choose the linear inequality that describes the graph. the gray area represents the shaded region. a: y ≤ –4x – 2 b: y > –4x – 2 c: y ≥ –4x – 2 d: y < 4x – 2
Answers: 2
Mathematics, 21.06.2019 21:50
Desmond wants to sell his car that he paid $8,000 for 2 years ago. the car depreciated, or decreased in value, at a constant rate each month over a 2-year period. if x represents the monthly depreciation amount, which expression shows how much desmond can sell his car for today? \ 8,000 + 24x 8,000 - 24x 8,000 + 2x 8,000 - 2x
Answers: 3
You know the right answer?
Questions

Mathematics, 12.02.2021 01:00
Mathematics, 12.02.2021 01:00


Mathematics, 12.02.2021 01:00
Mathematics, 12.02.2021 01:00
Mathematics, 12.02.2021 01:00

Mathematics, 12.02.2021 01:00
Mathematics, 12.02.2021 01:00


