Ms. Cebrera counted the number of absences each student in her class had last year.
She r...

Mathematics, 27.05.2020 17:58 amandaelisantos
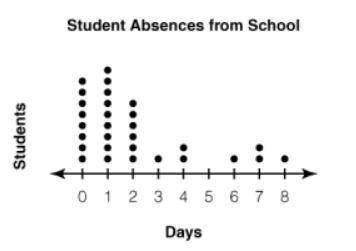
Ms. Cebrera counted the number of absences each student in her class had last year.
She recorded the results on the dot plot below.
Dot plot named as ALTDCStudent Absences from SchoolALTDC has number line from 0 to 8. 8 dots on 0, 9 dots on 1, 6 dots on 2, 1 dot on 3, 2 dots on 4, 1 dot on 6, 2 dots on 7 and 1 dot on 8 is given.
Which statement best describes the shape of the data?
A.
pulled to the left
B.
pulled to the right
C.
symmetric
D.
no noticeable shape

Answers: 2


Another question on Mathematics
Mathematics, 21.06.2019 18:30
To determine the number of deer in a forest a forest ranger tags 280 and releases them back
Answers: 3
Mathematics, 21.06.2019 21:30
Using pert, adam munson was able to determine that the expected project completion time for the construction of a pleasure yacht is 21 months, and the project variance is 4. a) what is the probability that the project will be completed in 17 months? b) what is the probability that the project will be completed in 20 months? c) what is the probability that the project will be completed in 23 months? d) what is the probability that the project will be completed in 25 months? e) what is the due date that yields a 95% chance of completion?
Answers: 3
You know the right answer?
Questions
Mathematics, 18.10.2019 01:30

History, 18.10.2019 01:30
Mathematics, 18.10.2019 01:30

Computers and Technology, 18.10.2019 01:30
Mathematics, 18.10.2019 01:30
History, 18.10.2019 01:30

Mathematics, 18.10.2019 01:30
Mathematics, 18.10.2019 01:30


Biology, 18.10.2019 01:30
Mathematics, 18.10.2019 01:30
English, 18.10.2019 01:30
Mathematics, 18.10.2019 01:30

Business, 18.10.2019 01:30
Mathematics, 18.10.2019 01:30


