
Mathematics, 26.05.2020 23:03 Geo777
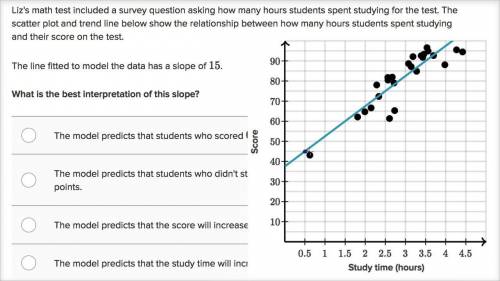
Liz's math test included a survey question asking how many hours students spent studying for the test. The scatterplot and regression line below show the relationship between how many hours students spent studying and their score on the test.
The fitted line has a slope of 15.
What is the best interpretation of this slope?
A
The model predicts that students who scored 0 studied for an average of 15 hours.
(Choice B)
B
The model predicts that students who didn't study at all will have an average score of 15 points.
(Choice C)
C
The model predicts that the score will increase 15 points for each additional hour of study time.
(Choice D)
D
The model predicts that the study time will increase 15 hours for each additional point scored.

Answers: 3


Another question on Mathematics
Mathematics, 21.06.2019 17:30
Aplot of land is shaped like a quadrilateral. fences are built on the diagonal to divide the area into 4 sections. what is vi to the nearest tenth? gv = 6.55fv = 5.84vh = 3.27vi = ?
Answers: 1
Mathematics, 21.06.2019 19:00
Write a function for a rotation 90 degrees counter clockwise about the origin, point 0
Answers: 1
Mathematics, 21.06.2019 23:40
Typically a point in a three dimensional cartesian coordinate system is represented by which of the following answers in the picture !
Answers: 1
Mathematics, 22.06.2019 01:00
X² + 4y² = 36 the major axis runs along: a) y=4x b) x-axis c) y-axis
Answers: 3
You know the right answer?
Liz's math test included a survey question asking how many hours students spent studying for the tes...
Questions

Business, 22.01.2021 06:20
Mathematics, 22.01.2021 06:20
Mathematics, 22.01.2021 06:20


Mathematics, 22.01.2021 06:20
Chemistry, 22.01.2021 06:20

History, 22.01.2021 06:20

English, 22.01.2021 06:20
Mathematics, 22.01.2021 06:20
Mathematics, 22.01.2021 06:20
Mathematics, 22.01.2021 06:20
Chemistry, 22.01.2021 06:20
Chemistry, 22.01.2021 06:20


