
Mathematics, 28.05.2020 22:05 keilyn80
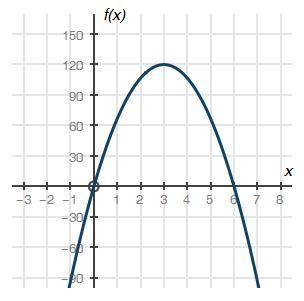
Please answer asap The graph below shows a company's profit f(x), in dollars, depending on the price of pens x, in dollars, sold by the company:
Graph of quadratic function f of x having x intercepts at ordered pairs 0, 0 and 6, 0. The vertex is at 3, 120.
Part A: What do the x-intercepts and maximum value of the graph represent? What are the intervals where the function is increasing and decreasing, and what do they represent about the sale and profit? (4 points)
Part B: What is an approximate average rate of change of the graph from x = 3 to x = 5, and what does this rate represent? (3 points)
Part C: Describe the constraints of the domain. (3 points)

Answers: 1


Another question on Mathematics
Mathematics, 22.06.2019 00:30
Which ordered pair identifies a point in quadrant iv? a) (2, 5) b) (0, 1) c) (-1, -1) d) (12, -5) which quadrant is (-4,-6) in? a) i. b) ii. c) iii. d) iv.
Answers: 3
Mathematics, 22.06.2019 02:00
Elm street is straight. willard's house is at point h between the school at point s and the mall at point m. if sh = 3 miles and hm = 4.5 miles, what is the value of sm in miles?
Answers: 1
Mathematics, 22.06.2019 02:30
What is the output, or dependent variable of quantity? 1: x 2: f(x) 3: y
Answers: 1
You know the right answer?
Please answer asap The graph below shows a company's profit f(x), in dollars, depending on the price...
Questions
Mathematics, 08.07.2019 20:00
Mathematics, 08.07.2019 20:00

Biology, 08.07.2019 20:00
Biology, 08.07.2019 20:00

Physics, 08.07.2019 20:00
Mathematics, 08.07.2019 20:00
Mathematics, 08.07.2019 20:00


History, 08.07.2019 20:00
Mathematics, 08.07.2019 20:00
Mathematics, 08.07.2019 20:00
Mathematics, 08.07.2019 20:00
Mathematics, 08.07.2019 20:00


