The box plot below shows the total amount of time, in minutes, the students of a
Part A: List...

Mathematics, 28.05.2020 13:59 popa60
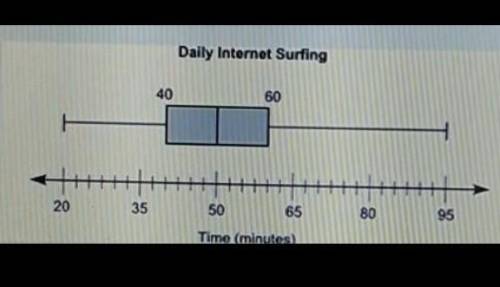
The box plot below shows the total amount of time, in minutes, the students of a
Part A: List two pieces of information that are provided by the graph and one piece of information that is not provided by the graph (4 points)
Part B: Calculate the interquartile range of the data, and explain in a sentence or two what it represents. (4 points)
Part C: Explain what affect, if any, there will be if an outlier is present (2 points)
PLEASE NO GUESSING, THANK YOU :)

Answers: 2


Another question on Mathematics
Mathematics, 21.06.2019 16:00
Successful implementation of a new system is based on three independent modules. module 1 works properly with probability 0.96. for modules 2 and 3, these probabilities equal 0.95 and 0.90. compute the probability that at least one of these three modules fails to work properly.
Answers: 2
Mathematics, 21.06.2019 19:30
The standard deviation for a set of data is 5.5. the mean is 265. what is the margin of error?
Answers: 3
Mathematics, 21.06.2019 23:30
Paul can type 60 words per minute and jennifer can type 80 words per minutes.how does paul's typing speed compare to jennifer's
Answers: 1
You know the right answer?
Questions
Mathematics, 24.02.2021 14:40


Mathematics, 24.02.2021 14:40

Biology, 24.02.2021 14:40

Advanced Placement (AP), 24.02.2021 14:40


Spanish, 24.02.2021 14:40

Social Studies, 24.02.2021 14:40


Mathematics, 24.02.2021 14:40
Mathematics, 24.02.2021 14:40


