Please answer ASAP & ethically. (25 pts.!)
The graph below shows a company's profit f(x),...

Mathematics, 28.05.2020 22:04 unknowntay04
Please answer ASAP & ethically. (25 pts.!)
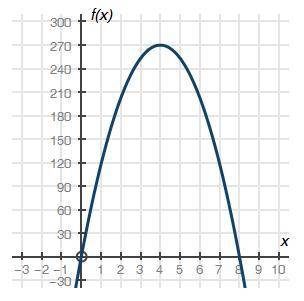
The graph below shows a company's profit f(x), in dollars, depending on the price of erasers x, in dollars, sold by the company:
Part A: What do the x-intercepts and maximum value of the graph represent? What are the intervals where the function is increasing and decreasing, and what do they represent about the sale and profit? (4 points)
Part B: What is an approximate average rate of change of the graph from x = 1 to x = 4, and what does this rate represent? (3 points)

Answers: 2


Another question on Mathematics
Mathematics, 21.06.2019 16:20
To prove that def ~ gfh by the sss similarity theorem using the information provided in the diagram, it would be enough additional information to know that
Answers: 3
Mathematics, 21.06.2019 20:30
Aswimming pool measures 22ft by 12ft and is 4ft deep. if the pool is being filled at 2.5 cubic ft per minute, how long will it take to fill the pool?
Answers: 1
Mathematics, 21.06.2019 20:30
1. evaluate 8x(2)y9(-2) for x=-1 and y=2 2. simplify the equation. -() 3. simplify the expression. [tex]\frac{5}{x(-2) y9(5)}[/tex]
Answers: 1
You know the right answer?
Questions
Mathematics, 25.09.2021 23:10

English, 25.09.2021 23:10

Computers and Technology, 25.09.2021 23:10
Mathematics, 25.09.2021 23:10
Mathematics, 25.09.2021 23:10

Health, 25.09.2021 23:10

History, 25.09.2021 23:10

Mathematics, 25.09.2021 23:10
Chemistry, 25.09.2021 23:10

Business, 25.09.2021 23:10

History, 25.09.2021 23:10
Mathematics, 25.09.2021 23:10
Mathematics, 25.09.2021 23:10


