Mathematics, 29.05.2020 20:58 jlluminate91671
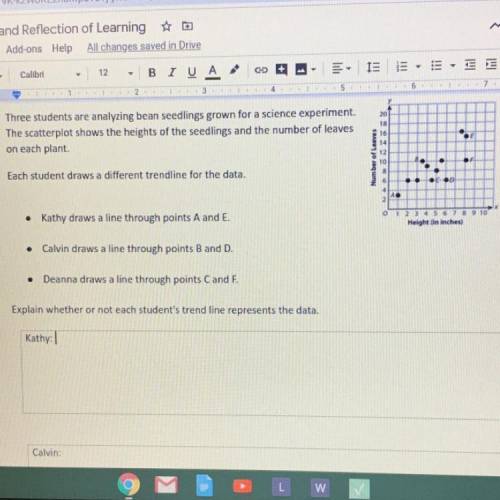
Three students are analyzing bean seedlings grown for a science experiment The scatterplot shows the heights of the seedlings and the number of leaves on each plant.
Each student draws a different tread line for the data.
-Kathy draws a line through points A and E.
-Calvin draws a line through points B and D.
-Deanna draws a line through points C and F.
Explain whether or not each student’s trend line represents the data.


Answers: 3


Another question on Mathematics

Mathematics, 21.06.2019 18:30
Which value would be a solution for x in the inequality 47-4x< 7
Answers: 1

Mathematics, 21.06.2019 19:00
Solve the problem. a student earned grades of c, a, b, and a in four different courses. those courses had these corresponding numbers of credit hours: 4, 5, 1, and 5. the grading system assigns quality points to letter grades as follows: a = 4, b = 3, c = 2, d = 1, and f = 0. compute the grade point average (gpa) and round the result to two decimal places. 3.40 3.50 8.75 2.18
Answers: 1

Mathematics, 21.06.2019 23:30
Which of the following exponential functions goes through the points (1, 6) and (2, 12)? f(x) = 3(2)x f(x) = 2(3)x f(x) = 3(2)−x f(x) = 2(3)−x
Answers: 1

Mathematics, 22.06.2019 01:00
5. write an equation for the line that is parallel to the given line and that passes through the given point. y = –5x + 3; (–6, 3)
Answers: 2
You know the right answer?
Three students are analyzing bean seedlings grown for a science experiment The scatterplot shows the...
Questions


Social Studies, 05.07.2019 00:30


English, 05.07.2019 00:30


Mathematics, 05.07.2019 00:30

English, 05.07.2019 00:30


History, 05.07.2019 00:30


