
Mathematics, 30.05.2020 00:04 JvGaming2001
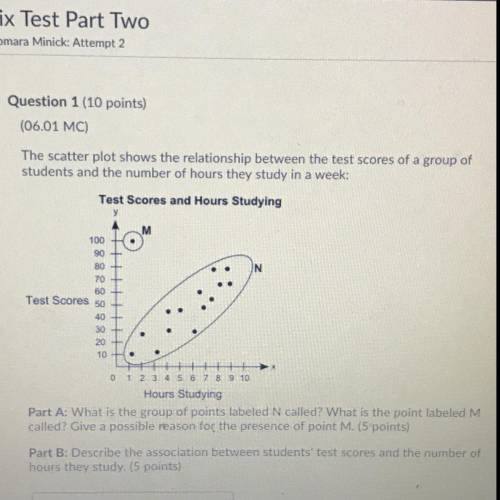
The scatter plot shows the relationship between the test scores of a group of students and the number of hours they study in a week:
On a grid, Label Hours Studying on x axis and Test Scores on y axis. The title of the graph is Test Scores and Hours Studying. The scale on the x axis shows the numbers from 0 to 10 at increments of 1, and the scale on the y axis shows numbers from 0 to 100 at increments of 10. Dots are made at the ordered pairs 1.1, 10 and 2, 25 and 3.1, 10.1 and 4, 30 and 4, 45 and 5, 45 and 6, 25 and 6.5, 60 and 7, 45 and 7.5, 50 and 7.5, 75 and 8, 60 and 8.5, 75 and 9, 60. The ordered pair 1, 100 is circled and labeled as M. All the other points are put in an oval and labeled as N.
Part A: What is the group of points labeled N called? What is the point labeled M called? Give a possible reason for the presence of point M. (5 points)
Part B: Describe the association between students' test scores and the number of hours they study.

Answers: 3


Another question on Mathematics
Mathematics, 21.06.2019 22:00
The difference of two numbers is 40. find the numbers if 0.3 parts of one number is equal to 37.5% of the other one.
Answers: 1
Mathematics, 22.06.2019 00:40
Astock has a 25% probability of increasing by $10 and a 75% probability of decreasing by $5. what is the stocks expected increase or decrease?
Answers: 1
Mathematics, 22.06.2019 01:00
If johnny ate 5 cans of sugar, but in the kitchen they only had 3. what did johnny eat? (he found a secret stash btw.)
Answers: 2
Mathematics, 22.06.2019 06:30
Find the mistake made in the steps to solve the equation below. a. the justification for step 2 is incorrect and should be the subtraction property of equality. b. step 2 is incorrect and should be . c. step 3 is incorrect and should be . d. the justification for step 3 is incorrect and should be the multiplication property of equality.
Answers: 2
You know the right answer?
The scatter plot shows the relationship between the test scores of a group of students and the numbe...
Questions

Business, 03.07.2019 05:30


English, 03.07.2019 05:30

Advanced Placement (AP), 03.07.2019 05:30
Advanced Placement (AP), 03.07.2019 05:30
Advanced Placement (AP), 03.07.2019 05:30

Spanish, 03.07.2019 05:30
Spanish, 03.07.2019 05:30
Mathematics, 03.07.2019 05:30
Advanced Placement (AP), 03.07.2019 05:30


