
Mathematics, 30.05.2020 21:05 jeto32
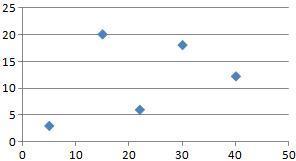
The chart shows a country's annual egg production. Model the data in the chart with a linear function, using the points
(4,58.3) and (6,62.5). Predict egg production in 2003.
Year, x
Egg Production, y
(in billions)
1994, 0
52.6
1995, 1
53.4
1996, 2
54.9
1997, 3
56.4
1998, 4
58.3
1999, 5
61.0
2000, 6
62.5
What is the linear model for the data? y=?
What will egg production be in 2003? ___ billion

Answers: 2


Another question on Mathematics
Mathematics, 21.06.2019 19:10
In the triangles, bc =de and ac fe.if the mzc is greater than the mze, then ab isdfelth
Answers: 2
Mathematics, 21.06.2019 22:00
Which two undefined geometric terms always describe figures with no beginning or end?
Answers: 3
Mathematics, 21.06.2019 23:30
Katie wants to collect over 100 seashells. she already has 34 seashells in her collection. each day, she finds 12 more seashells on the beach. katie can use fractions of days to find seashells. write an inequality to determine the number of days, dd, it will take katie to collect over 100 seashells.
Answers: 1
Mathematics, 22.06.2019 00:20
Convert the number to decimal form. 12) 312five a) 82 b) 30 c) 410 d) 1560 13) 156eight a) 880 b) 96 c) 164 d) 110 14) 6715eight a) 53,720 b) 3533 c) 117 d) 152
Answers: 1
You know the right answer?
The chart shows a country's annual egg production. Model the data in the chart with a linear functio...
Questions
Mathematics, 06.05.2020 04:25
Mathematics, 06.05.2020 04:25

History, 06.05.2020 04:25
History, 06.05.2020 04:25

Computers and Technology, 06.05.2020 04:25


Arts, 06.05.2020 04:25

English, 06.05.2020 04:25


Mathematics, 06.05.2020 04:25
Mathematics, 06.05.2020 04:25


