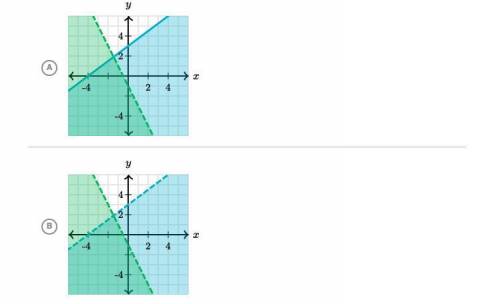
Y< 4/3x + 3
y≤−2x−1
Which graph represents the system of inequalities?<...

Mathematics, 31.05.2020 00:00 farh
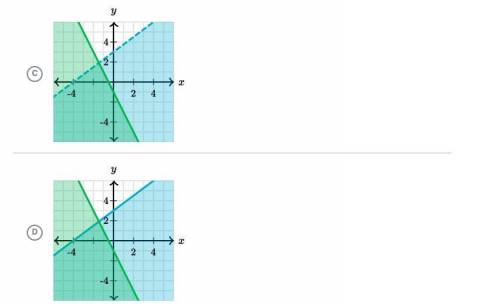
Y< 4/3x + 3
y≤−2x−1
Which graph represents the system of inequalities?

Answers: 1


Another question on Mathematics
Mathematics, 21.06.2019 16:30
Marco is studying a type of mold that grows at a fast rate. he created the function f(x) = 345(1.30)x to model the number of mold spores per week. what does the 1.30 represent? how many mold spores are there after 4 weeks? round your answer to the nearest whole number. 1.30 represents the number of mold spores marco had at the beginning of the study; 985 mold spores 1.30 represents the number of mold spores grown in a given week; 448 mold spores 1.30 represents the 30% rate of weekly growth; 345 mold spores 1.30 represents the 30% rate of weekly growth; 985 mold spores
Answers: 1
Mathematics, 21.06.2019 21:30
The price of a visit to the dentist is calculated according to the formula 50+100n50+100n where nn is the number of cavities the dentist finds. on your last visit to the dentist, 22 cavities were found. what was the cost of your visit?
Answers: 2
Mathematics, 21.06.2019 23:00
Perry observes the opposite parallel walls of a room in how many lines do the plains containing the walls intersect
Answers: 1
Mathematics, 22.06.2019 00:40
Astock has a 25% probability of increasing by $10 and a 75% probability of decreasing by $5. what is the stocks expected increase or decrease?
Answers: 1
You know the right answer?
Questions
Mathematics, 11.09.2019 18:10

Computers and Technology, 11.09.2019 18:10


English, 11.09.2019 18:10
Computers and Technology, 11.09.2019 18:10
English, 11.09.2019 18:10
Computers and Technology, 11.09.2019 18:10
Mathematics, 11.09.2019 18:10


