Mathematics, 02.06.2020 20:58 dudejustdont
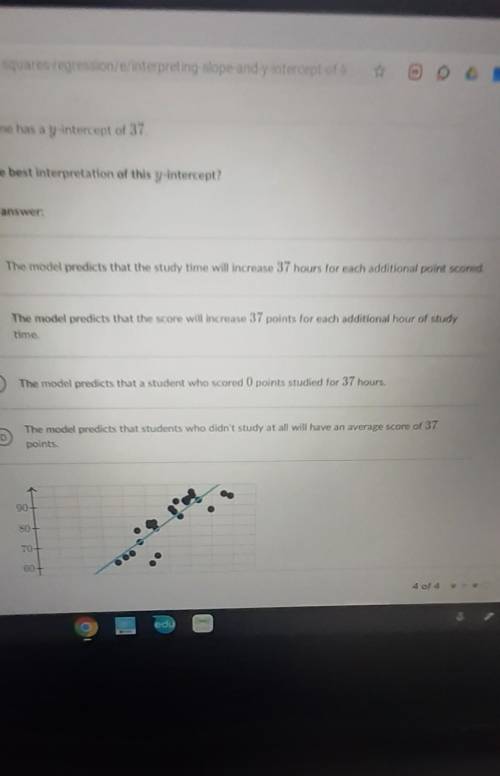
Camille's math test included a survey question asking how many hours students spent studying for the test.
The scatterplot and regression line below show the relationship between how many hours students spent
studying and their score on the test.
The fitted line has a y-intercept of 37.
What is the best interpretation of this y-intercept?
Choose 1 .


Answers: 1


Another question on Mathematics

Mathematics, 21.06.2019 19:30
If you can solve all of these i will give ! - 4% of 190 - 4% of 162.5 - 4% of 140 - a 4% increase from 155.1 - a 4% increase from 159.8
Answers: 2

Mathematics, 21.06.2019 20:00
It is given that the quadratic equation hx²-3x+k=0, where h and k are constants, has roots [tex] \beta \: and \: 2 \beta [/tex]express h in terms of k
Answers: 2

Mathematics, 21.06.2019 21:30
Mario is constructing a frame for 10 in. by 8 in. photo. he wants the frame to be the same with all the way around in the same area of the frame and photo to be 120 square inches what is the dimension of the frame?
Answers: 1

Mathematics, 21.06.2019 23:00
Events a and b are independent. the probability of a occurring is 2/5. the probability of b occurring is 1/4. what is p(a and b)?
Answers: 2
You know the right answer?
Camille's math test included a survey question asking how many hours students spent studying for the...
Questions


History, 02.03.2021 01:00


History, 02.03.2021 01:00

English, 02.03.2021 01:00

Mathematics, 02.03.2021 01:00

History, 02.03.2021 01:00


Physics, 02.03.2021 01:00


Geography, 02.03.2021 01:00

Social Studies, 02.03.2021 01:00

Mathematics, 02.03.2021 01:00


