
Mathematics, 03.06.2020 19:03 growingideas
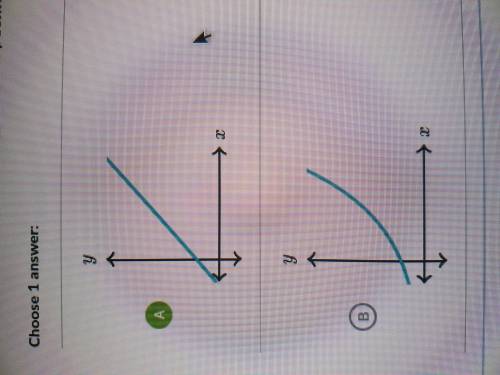
The table represents the number of milkshakes sold by a restaurant since they were added to the menu.
Time (months)Milkshakes sold
1 259
4 380
7 501
10 622
13 744
Which graph best represents the relationship between time and the number of milkshakes sold?

Answers: 1


Another question on Mathematics
Mathematics, 20.06.2019 18:02
Sandy works at a clothing store. she makes $7 per hour plus earns 15% commission on her sales. she worked 75 hours over the last two weeks and had a total of $2,566 in sales before taxes. which of the following is closest to how much she will earn in hourly wages and commission for those two weeks?
Answers: 1
Mathematics, 21.06.2019 17:50
On a string instrument, the length of a string varies inversely as the frequency of its vibrations. an 11-inch string has a frequency of 400 cylces per second. find the frequency of a 10-icnch string.
Answers: 2
Mathematics, 21.06.2019 19:30
Two variables, x and y, vary inversely, and x=12 when y=4. what is the value of y when x=3?
Answers: 1
Mathematics, 21.06.2019 22:50
Aweekly newspaper charges $72 for each inch in length and one column width. what is the cost of an ad that runs 2 column inches long and 2 columns wide? its not 288
Answers: 1
You know the right answer?
The table represents the number of milkshakes sold by a restaurant since they were added to the menu...
Questions

Mathematics, 25.05.2021 23:50
Mathematics, 25.05.2021 23:50


English, 25.05.2021 23:50
Mathematics, 25.05.2021 23:50
Mathematics, 25.05.2021 23:50
History, 25.05.2021 23:50
Mathematics, 25.05.2021 23:50

Chemistry, 25.05.2021 23:50

Social Studies, 25.05.2021 23:50
Chemistry, 25.05.2021 23:50
Mathematics, 25.05.2021 23:50


