What is the range of the function on the graph?
5 4 3 2 O all real numbers O all real numbers less than or equal to -1 O all real numbers less than or equal to 3 O all real numbers less than or equal to 0 - -4 -3 -2 -1, 1 2 3 4 5 X -4
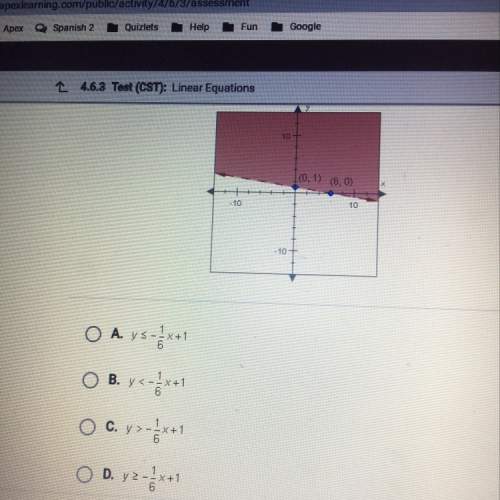
your answer is c because y > means up & it's shaded up, but y < means down
hope this ! : )
Answer from: Quest
what
Another question on Mathematics
Mathematics, 21.06.2019 20:00
Someone answer asap for ! max recorded the heights of 500 male humans. he found that the heights were normally distributed around a mean of 177 centimeters. which statements about max’s data must be true? a. the median of max’s data is 250 b. more than half of the data points max recorded were 177 centimeters. c. a data point chosen at random is as likely to be above the mean as it is to be below the mean. d. every height within three standard deviations of the mean is equally likely to be chosen if a data point is selected at random.
Awoman has 14 different shirts: 10 white shirts and 4 red shirts. if she randomly chooses 2 shirts to take with her on vacation, then what is the probability that she will choose two white shirts? show your answer in fraction and percent, round to the nearest whole percent.
No commitments. Cancel anytime. All pricing is in US dollars (USD). The subscriptoin renews automaticaly until you cancel. For more information read our Terms of use & Privacy Policy