
Mathematics, 05.06.2020 18:02 officialariana01
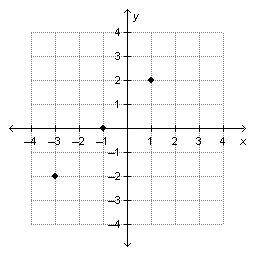
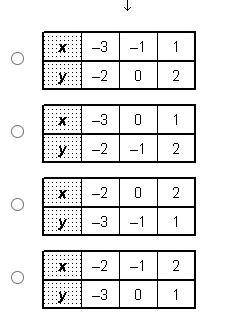
Which table of values will generate this graph? On a coordinate plane, points are at (negative 3, negative 2), (negative 1, 0), and (1, 2). A 2-column table with 3 rows. Column 1 is labeled x with entries negative 3, negative 1, 1. Column 2 is labeled y with entries negative 2, 0, 2. A 2-column table with 3 rows. Column 1 is labeled x with entries negative 3, 0, 1. Column 2 is labeled y with entries negative 2, negative 1, 2. A 2-column table with 3 rows. Column 1 is labeled x with entries negative 2, 0, 2. Column 2 is labeled y with entries negative 3, negative 1, 1. A 2-column table with 3 rows. Column 1 is labeled x with entries negative 2, negative 1, 2. Column 2 is labeled y with entries negative 3, 0, 1.

Answers: 1


Another question on Mathematics
Mathematics, 21.06.2019 22:30
What is the approximate value of x in the equation below.–3.396–0.7080.3040.955
Answers: 1
Mathematics, 22.06.2019 00:30
1/2+1/6-3/4 simplify the given expression leaving the answer in improper fraction form.
Answers: 2
You know the right answer?
Which table of values will generate this graph? On a coordinate plane, points are at (negative 3, ne...
Questions
Mathematics, 27.05.2021 05:40

History, 27.05.2021 05:40

Computers and Technology, 27.05.2021 05:40
Mathematics, 27.05.2021 05:40

Mathematics, 27.05.2021 05:40

Mathematics, 27.05.2021 05:40
Mathematics, 27.05.2021 05:50


