Mathematics, 05.06.2020 23:05 shazaam1657
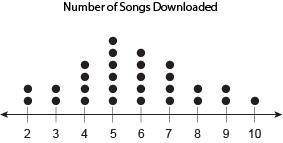
This graph shows the number of songs downloaded in a week by different people. Select from the drop-down menus to correctly complete the statement. The distribution of data is ___ (Drop down answers: Approximately normal Uniform Skewed left Skewed right), with a median of ___ (Drop down answers: 5 5.5 6 6.5), and a range of ___ (Drop down Answers: 2 8 10 12) .


Answers: 1


Another question on Mathematics

Mathematics, 21.06.2019 18:00
The given dot plot represents the average daily temperatures, in degrees fahrenheit, recorded in a town during the first 15 days of september. if the dot plot is converted to a box plot, the first quartile would be drawn at __ , and the third quartile would be drawn at __ link to graph: .
Answers: 1

Mathematics, 21.06.2019 18:40
Aportion of a hiking trail slopes downward at about an 84° angle. to the nearest tenth of a flot, what is the value of x, the distance the hiker traveled along the path, if he has traveled a horizontal distance of 120 feet? a. 143.3 b. 12.5 c. 120.7 d. 130.2
Answers: 1

Mathematics, 21.06.2019 19:30
Write the expression 7x^3-28xy^2 as the product of 3 factors
Answers: 2

Mathematics, 22.06.2019 00:20
The circle below is centered at the point (3, 1) and has a radius of length 2. what is the equation?
Answers: 1
You know the right answer?
This graph shows the number of songs downloaded in a week by different people. Select from the drop-...
Questions


Mathematics, 26.06.2020 15:01


Mathematics, 26.06.2020 15:01


French, 26.06.2020 15:01


Physics, 26.06.2020 15:01

Mathematics, 26.06.2020 15:01


