
Mathematics, 06.06.2020 22:00 xfuartado
Scores on the Graduate Requirement Exam. This is a standardized test for people entering graduate school. The horizontal axis would be the person's total score. The vertical axis would be frequency (number of people with that score). The population would be all GRE test takers for a given year. Shape of distribution:.

Answers: 2


Another question on Mathematics
Mathematics, 21.06.2019 22:00
Astudent has created the give circuit diagram. it consists of a battery, a resistor, and a light bulb. in one minute, 1.2c of charge flows through the resistor. how much charge flows through the light bulb in one minute?
Answers: 1
Mathematics, 21.06.2019 23:00
In triangle △abc, ∠abc=90°, bh is an altitude. find the missing lengths. ac=26 and ch=8, find bh.
Answers: 3
Mathematics, 22.06.2019 00:30
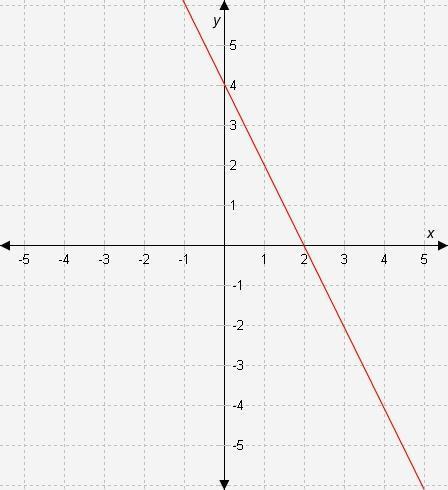
Which equation could represent the relationship shown in the scatter plot? y=−3x−2 y=−3/4x+10 y=−2/3x+1 y=9x−12 scatter plot with x axis labeled variable x and y axis labeled variable y. points go from upper left to lower right.
Answers: 1
You know the right answer?
Scores on the Graduate Requirement Exam. This is a standardized test for people entering graduate sc...
Questions

Mathematics, 18.05.2021 14:00
Mathematics, 18.05.2021 14:00

Chemistry, 18.05.2021 14:00

Arts, 18.05.2021 14:00

Physics, 18.05.2021 14:00


French, 18.05.2021 14:00
Mathematics, 18.05.2021 14:00
Mathematics, 18.05.2021 14:00
Mathematics, 18.05.2021 14:00
Mathematics, 18.05.2021 14:00
Physics, 18.05.2021 14:00


