
Mathematics, 06.06.2020 13:57 DVM117x017
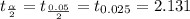
The manufacturer of an airport baggage scanning machine claims it can handle an average of 560 bags per hour. (a-1) At α = .05 in a left-tailed test, would a sample of 16 randomly chosen hours with a mean of 538 and a standard deviation of 50 indicate that the manufacturer’s claim is overstated? Choose the appropriate hypothesis.

Answers: 1


Another question on Mathematics
Mathematics, 22.06.2019 01:50
Our star pitcher, foster enlight, can throw a pitch so fast that it gets to the catcher’s mitt before it leaves foster’s fingers! if the team wins a game then the probability that foster was pitching is 0.8 but only if foster had at least one day’s rest since his last pitching assignment. if foster does not have a day off and the team still wins, the probability that foster was pitching drops by half of what it was on the previous day. if the team wins three games in succession from the toronto tachyons and foster pitched in game #2, what is the probability that he pitched in one or more of the other games? (assume that foster did not pitch on the day before the first game of this three game series.)
Answers: 1
Mathematics, 22.06.2019 02:30
Atrain traveled for 1.5 hours to the first station, stopped for 30 minutes, then traveled for 4 hours to the final station where it stopped for 1 hour. the total distance traveled is a function of time. which graph most accurately represents this scenario? a graph is shown with the x-axis labeled time (in hours) and the y-axis labeled total distance (in miles). the line begins at the origin and moves upward for 1.5 hours. the line then continues upward at a slow rate until 2 hours. from 2 to 6 hours, the line continues quickly upward. from 6 to 7 hours, it moves downward until it touches the x-axis a graph is shown with the axis labeled time (in hours) and the y axis labeled total distance (in miles). a line is shown beginning at the origin. the line moves upward until 1.5 hours, then is a horizontal line until 2 hours. the line moves quickly upward again until 6 hours, and then is horizontal until 7 hours a graph is shown with the axis labeled time (in hours) and the y-axis labeled total distance (in miles). the line begins at the y-axis where y equals 125. it is horizontal until 1.5 hours, then moves downward until 2 hours where it touches the x-axis. the line moves upward until 6 hours and then moves downward until 7 hours where it touches the x-axis a graph is shown with the axis labeled time (in hours) and the y-axis labeled total distance (in miles). the line begins at y equals 125 and is horizontal for 1.5 hours. the line moves downward until 2 hours, then back up until 5.5 hours. the line is horizontal from 5.5 to 7 hours
Answers: 1
Mathematics, 22.06.2019 04:00
What is the answer to this problem? ignore the work. what is the correct answer?
Answers: 1
You know the right answer?
The manufacturer of an airport baggage scanning machine claims it can handle an average of 560 bags...
Questions

Biology, 13.01.2021 22:50
Mathematics, 13.01.2021 22:50
Mathematics, 13.01.2021 22:50

Geography, 13.01.2021 22:50
Mathematics, 13.01.2021 22:50
Geography, 13.01.2021 22:50

Physics, 13.01.2021 22:50
Mathematics, 13.01.2021 22:50


Business, 13.01.2021 22:50
Mathematics, 13.01.2021 22:50
Mathematics, 13.01.2021 22:50


