
Mathematics, 07.06.2020 05:02 kkennethbrown9222
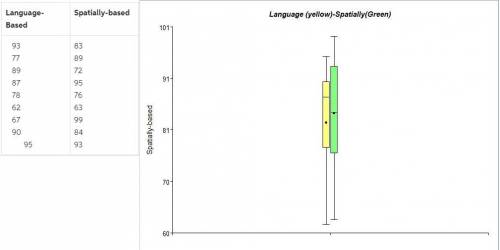
The independent-samples t testResearch Scenario: A forensic psychologist has developed a new program that teaches empathy and positive social skills to youth offenders who are incarcerated for a violent offense. She wants to know whether this new treatment is more effective in increasing empathy than the standard treatment that these youth offenders usually receive. She sets up a treatment group that consists of 8 youth offenders incarcerated for violent offenses who will receive the new treatment. Her control group consists of 8 similar youth offenders who receive the standard treatment only. At the end of treatment, she administers the Basic Empathy Scale (BES; Jolliffe and Farrington, 2006), a 20-item questionnaire where higher scores indicate higher levels of empathy, and records the results in the table below. Using this table, enter the data into a new SPSS data file and run an independent-samples t test to test the claim that violent youth offenders who receive the new treatment will have higher BES scores than violent youth offenders who receive standard treatment. Follow the directions below the table to complete the homework. Language-Based Spatially-based 93 83 77 89 89 72 87 95 78 76 62 63 67 99 90 84 95 931. Paste SPSS output. 2. Write an APA-style Results section based on your analysis. Include your boxplot as an APA-style figure as demonstrated in the APA writing presentation. (Results = 8 pts: Graph = 5 pts)

Answers: 1


Another question on Mathematics
Mathematics, 21.06.2019 16:30
Arandom sample of 150 high school students were asked whether they have a job. the results are shown in the table. have a job do not have a job male 48 35 female 41 26 select a ord or phrase from the drop-down menus to correctly complete the statements describing the association.
Answers: 1
Mathematics, 21.06.2019 20:30
Pyramid shown has a square base that is 18 inches on each side has a surface area of 164 square inches what is the slant height
Answers: 3
Mathematics, 21.06.2019 20:40
The graph of a function f(x)=(x+2)(x-4). which describes all of the values for which the graph is negative and increasing? all real values of x where x< -2 all real values of x where -2
Answers: 2
Mathematics, 21.06.2019 21:00
Ireally need subtract and simplify.(-y^2 – 4y - 8) – (-4y^2 – 6y + 3)show your work, ! i will mark you brainliest but you have to show your work.
Answers: 1
You know the right answer?
The independent-samples t testResearch Scenario: A forensic psychologist has developed a new program...
Questions


Mathematics, 26.08.2019 10:20
Mathematics, 26.08.2019 10:20

Physics, 26.08.2019 10:20
Mathematics, 26.08.2019 10:20
History, 26.08.2019 10:20
Mathematics, 26.08.2019 10:20
Physics, 26.08.2019 10:20
Mathematics, 26.08.2019 10:20


