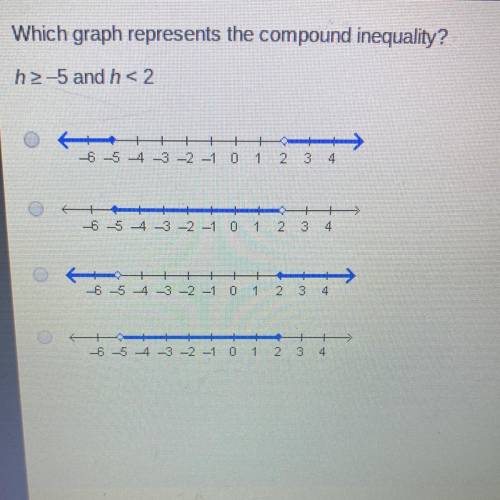
Which graph represents the compound inequality?
h2-5 and h< 2
-6 -5 -4 -3 -2 -1 0 1 2 3 4<...

Mathematics, 08.06.2020 06:57 chloeethoma24
Which graph represents the compound inequality?
h2-5 and h< 2
-6 -5 -4 -3 -2 -1 0 1 2 3 4
+
-6 -5 -4 -3 -2 -1 0 1 2 3 4
+
|-6 -5 4 -3 -2 -1 0 1 2 3 4
>
-6 -5 -4 -3 -2 -1 0 1 2 3


Answers: 2


Another question on Mathematics

Mathematics, 21.06.2019 13:20
In an experiment you are to flip a two sided coin 100 times and record 55 heads up and 45 tails up determine the theoretical and experimental probability of getting a heads up in the experiment.
Answers: 3

Mathematics, 21.06.2019 17:30
Select the correct answer from the drop-down menu. subtracting 3xy^2 from 8xy^2 gives the same result as the expression. [tex]3xy ^{2} - 8xy ^{2} [/tex][tex] { - 7xy}^{2} - {2xy}^{2} [/tex][tex] {7xy}^{2} - {2xy}^{2} [/tex]
Answers: 3

Mathematics, 21.06.2019 19:40
The owners of four companies competing for a contract are shown in the table below. if a report is released that advocates company b, which of the people having funded the report should result in the most skepticism? company owner of company company a jake adams company b company c company d debby smith henry rose rhonda baker o a. jake adams o b. rhonda baker o c. debby smith o d. henry rose
Answers: 2

Mathematics, 21.06.2019 20:00
Suppose a store sells an average of 80 cases of soda per day. assume that each case contains 24 cans of soda and that the store is open 10 hours per day. find the average number of soda that the store sells per hour.
Answers: 1
You know the right answer?
Questions


Mathematics, 17.10.2019 09:10


Advanced Placement (AP), 17.10.2019 09:10


Biology, 17.10.2019 09:10

Social Studies, 17.10.2019 09:10

History, 17.10.2019 09:10

Mathematics, 17.10.2019 09:10


Mathematics, 17.10.2019 09:10

English, 17.10.2019 09:10


Biology, 17.10.2019 09:10

Business, 17.10.2019 09:10


