
Mathematics, 09.06.2020 18:57 samm2002
A survey was sent out to compare the proportion of adults who use their car horns when driving for two age populations (1=younger adults, defined as between 20 and 39 years old and 2 =older adults, defined as over 60 years old). The following data was obtained from those who responded.
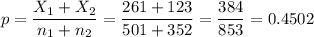
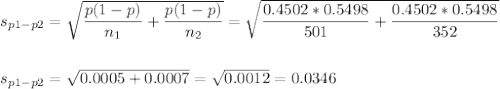
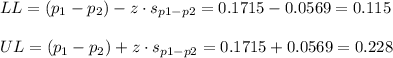
Calculate the 90% confidence interval using the standard normal distribution. Note that 1 =0.52. P2= 0.35, and s. e.(P1-P2) =0.0338. Round to the fourth decimal point. Please enter you answer in the following format: (lower value, upper value)
Use the horn Use the horn
Group Yes No Total
1= younger adults 261 240 501
2= older adults 123 229 352

Answers: 3


Another question on Mathematics
Mathematics, 21.06.2019 15:50
Arectangle has a width of 9 units and length of 40 units. what is the length of a diognal. a. 31 unitsb. 39 unitsc. 41 units d. 49 units
Answers: 1
Mathematics, 21.06.2019 16:30
896.31 cm= km 100cm = 1m 1000m = 1km a) 0.0089631 b) 0.0089631 c) 8.9631 d) 89.631
Answers: 2
Mathematics, 21.06.2019 19:10
Alogical argument that is presented in graphical form using boxes and arrows is called?
Answers: 1
Mathematics, 21.06.2019 23:00
Perry observes the opposite parallel walls of a room in how many lines do the plains containing the walls intersect
Answers: 1
You know the right answer?
A survey was sent out to compare the proportion of adults who use their car horns when driving for t...
Questions


Physics, 02.10.2019 14:30


Mathematics, 02.10.2019 14:30
Mathematics, 02.10.2019 14:30
Mathematics, 02.10.2019 14:30

Chemistry, 02.10.2019 14:30
Mathematics, 02.10.2019 14:30


History, 02.10.2019 14:30
Mathematics, 02.10.2019 14:30
History, 02.10.2019 14:30


