This Question: 4 pts
1 of 11 (0 complete)
Music Preferences
Students at a high school wer...

Mathematics, 09.06.2020 21:57 jesser9
This Question: 4 pts
1 of 11 (0 complete)
Music Preferences
Students at a high school were polled to determine the type of music they preferred. There were 1960 students who
completed the poll. Their responses are represented in the circle graph.
Rap 916
Alternative 46
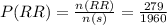
Rock and Roll 279
Country 183
Jazz 32
Other 89
About What % of the students who completed the poll preferred rock and roll music.
(Round to one decimal place as needed.)

Answers: 2


Another question on Mathematics
Mathematics, 21.06.2019 17:20
Acredit card advertises an annual interest rate of 23%. what is the equivalent monthly interest rate?
Answers: 1
Mathematics, 21.06.2019 17:20
Aboat costs 19200 and decreases in value by 12% per year. how much will it cost in 5 years
Answers: 2
Mathematics, 21.06.2019 23:40
You are saving to buy a bicycle; so far you save 55.00. the bicycle costs 199.00. you earn 9.00 per hour at your job. which inequality represents the possible number of h hours you need to work to buy the bicycle?
Answers: 2
You know the right answer?
Questions

Mathematics, 03.07.2020 20:01
Mathematics, 03.07.2020 20:01


Mathematics, 03.07.2020 20:01

Mathematics, 03.07.2020 20:01


Mathematics, 03.07.2020 20:01


